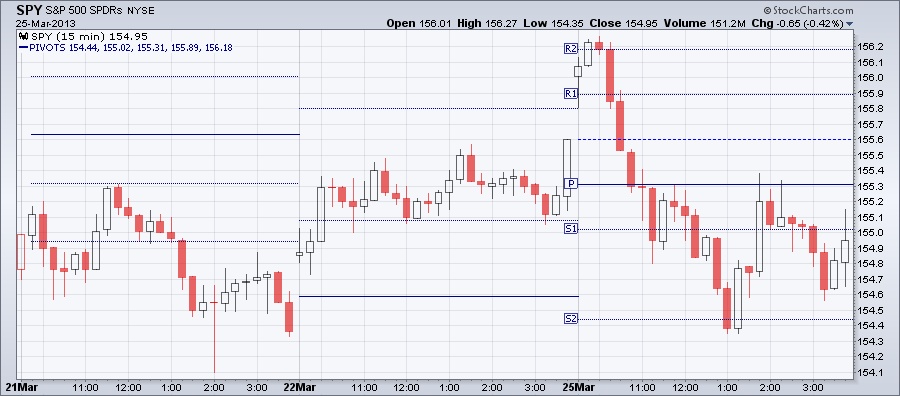
SSO is the ProShares Ultra S&P 500 Fund and SDS is the ProShares Ultra Short S&P 500 Fund. With these two ETFs you can take advantage when the market moves up or down. Buy SSO when the spread between the bottom two charts narrows and Buy SDS when it widens. The chart below is a 15 Min charts so it's only for short term trading. Currently the spread between SSO and SDS narrows.
0 Comments
The Stochastic Oscillator is a momentum indicator which tracks the current location relative to the high-low range in a set number of periods. As a momentum indicator it changes direction before price. The Stochastic Oscillator is calculated as follows:
%K = (Current Close - Lowest Low)/(Highest High - Lowest Low) * 100 The StochRSI is the Stochastic calculation applied to RSI. This makes StochRSI an indicator of an indicator. The calculation is the following: StochRSI = (RSI - Lowest Low RSI) / (Highest High RSI - Lowest Low RSI) StochRSI moves between 0 and 1. This momentum indicator can be used to identify trends, trend reversals, oversold and overbought conditions. The chart below shows the weekly chart for SPY with StochRSI. As you can see StochRSI moved to 0 but the 5 period EMA of StochRSI is still above 0.5. When in previous instances SPY moved to 0 it signaled the beginning of a medium-term correction. Also notice heavier selling volume. As you can see on the performance chart below EWJ is outperforming SPY but they are still positively correlated.
I mentioned in a previous post that there are basically for types of technical indicators. One of them is volatility indicators. One way to add volatility indicator to your chart is to use Bollinger Bands.
Bollinger Bands consist of a middle band and two outer bands. The middle band is a simple moving average, usually the 20-period SMA. The outer bands are usually set 2 standard deviation above and below the middle band. The bands narrow when volatility decreases and widen when volatility increases. The Bollinger Band Width indicator focuses only on the difference between the upper and lower band. A percentage value is calculated. The Bollinger Band Width helps us to identify periods when the volatility level is very low, prices are flat. This is called the squeeze. Periods of very low volatility are usually followed by periods of high volatility. After a squeeze prices can break above the upper band or below the lower band. Usually these breaks are strong. The chart below shows SPY with the Bollinger Bands and the Bollinger Band Width indicator. As you can see right now the bands are narrowing. Also prices are moving away from the upper band. I posted yesterday about Pivot Points. On the chart below I want to show you how it worked out today. This is a 15-minute chart for the past three days with the daily pivot points. As you can see SPY showed strength this morning and moved all the way up to R2 resistance. It didn't hold there, quickly turned around and moved all the way down to S2 support. This is an oversold area where SPY bounced back but couldn't break the pivot point resistance. The morning strength turned into weakness.
Pivot Points are leading indicators. They "predict" price movements in the future, next day, next week, next year depending on the time frame. Once they are calculated for the current day, week, month, year they don't change. They originally used by floor traders the original day traders to set key levels for the next day.
Pivot Points are calculated from the previous day, week, month or year from the previous close, high and low. There are different types of Pivot Points and their calculation is different. The results of the calculation are the Pivot Point and the support and resistance pivots. The Standard Pivot Points have two support and two resistance levels. The calculation is the following: Pivot Point (P) = (High + Low + Close)/3 Support 1 (S1) = (P x 2) - High Support 2 (S2) = P - (High - Low) Resistance 1 (R1) = (P x 2) - Low Resistance 2 (R2) = P + (High - Low) A move above the Pivot Point shows strength and breaking above R1 and R2 shows even more strength in an uptrend. When prices move below the Pivot Point it demonstrates weakness. When prices reach R2 they are considered overbought and when they reach S2 they are oversold. The chart below shows the monthly Pivot Points for SPY. As you can see prices are in the R2 area. SPY is short term overbought and going thru consolidation. Depending which way SPY will move next week we will see if this consolidation will result in strength or further weakness. I posted earlier about this observation here. As you can see on the chart below SPY and EEM (emerging markets) have been closely correlated except since the beginning of this year. Most of the time the correlation was close to 1.0. This year the correlation turned negative for a longer period of time. Something has to give. We will find out in a month or two.
I like to check out the weekly charts almost as frequently as the daily charts. Depending on the look back period some indicators can move faster. The very popular RSI indicator slowly moved into the overbought area. SPY can still move higher but there is a chance that a bigger correction is on the way. It was in early 2011 when RSI moved above 70 which ended up in a bigger decline later that year.
The chart below shows the basic 5-wave impulse sequence for the current uptrend. There are only three hard rules for the Elliott Waves:
Open interest for different strike prices are calculated at the end of the trading day. Open interest or OI is telling us how many contracts for a certain strike price are not closed. Open interest is calculated for puts and calls fro all strike prices. Open interest configuration shows the different open interests for different strike prices. On the open interest configuration charts the strike prices are on the horizontal axis and the open interest are on the vertical axis. We can use this chart in our analysis which describes the relative levels of investor optimism and pessimism. When we look at the chart for the front moths spikes represent short term support and resistance levels where traders have to be cautious. Below you can see the open interest configuration chart for SPY.
|
Loading
Search Site
Links
Archives
September 2014
Categories
All
|