Pivot Points are leading indicators. They "predict" price movements in the future, next day, next week, next year depending on the time frame. Once they are calculated for the current day, week, month, year they don't change. They originally used by floor traders the original day traders to set key levels for the next day.
Pivot Points are calculated from the previous day, week, month or year from the previous close, high and low. There are different types of Pivot Points and their calculation is different. The results of the calculation are the Pivot Point and the support and resistance pivots. The Standard Pivot Points have two support and two resistance levels. The calculation is the following:
Pivot Point (P) = (High + Low + Close)/3
Support 1 (S1) = (P x 2) - High
Support 2 (S2) = P - (High - Low)
Resistance 1 (R1) = (P x 2) - Low
Resistance 2 (R2) = P + (High - Low)
A move above the Pivot Point shows strength and breaking above R1 and R2 shows even more strength in an uptrend. When prices move below the Pivot Point it demonstrates weakness. When prices reach R2 they are considered overbought and when they reach S2 they are oversold.
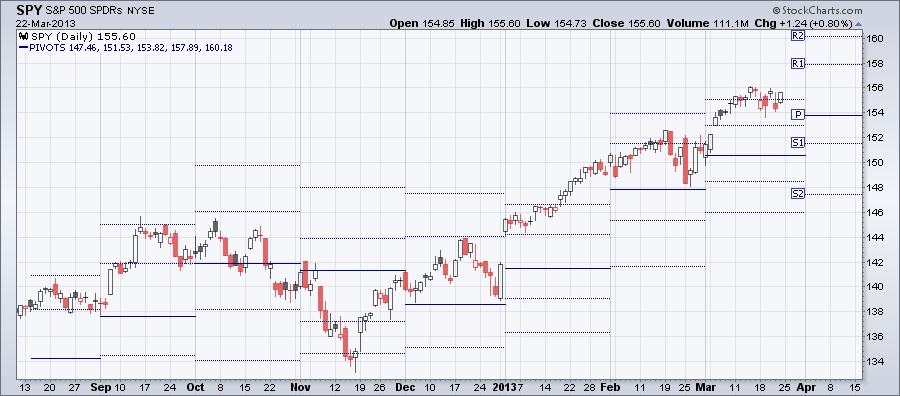
The chart below shows the monthly Pivot Points for SPY. As you can see prices are in the R2 area. SPY is short term overbought and going thru consolidation. Depending which way SPY will move next week we will see if this consolidation will result in strength or further weakness.
Pivot Points are calculated from the previous day, week, month or year from the previous close, high and low. There are different types of Pivot Points and their calculation is different. The results of the calculation are the Pivot Point and the support and resistance pivots. The Standard Pivot Points have two support and two resistance levels. The calculation is the following:
Pivot Point (P) = (High + Low + Close)/3
Support 1 (S1) = (P x 2) - High
Support 2 (S2) = P - (High - Low)
Resistance 1 (R1) = (P x 2) - Low
Resistance 2 (R2) = P + (High - Low)
A move above the Pivot Point shows strength and breaking above R1 and R2 shows even more strength in an uptrend. When prices move below the Pivot Point it demonstrates weakness. When prices reach R2 they are considered overbought and when they reach S2 they are oversold.
The chart below shows the monthly Pivot Points for SPY. As you can see prices are in the R2 area. SPY is short term overbought and going thru consolidation. Depending which way SPY will move next week we will see if this consolidation will result in strength or further weakness.

 RSS Feed
