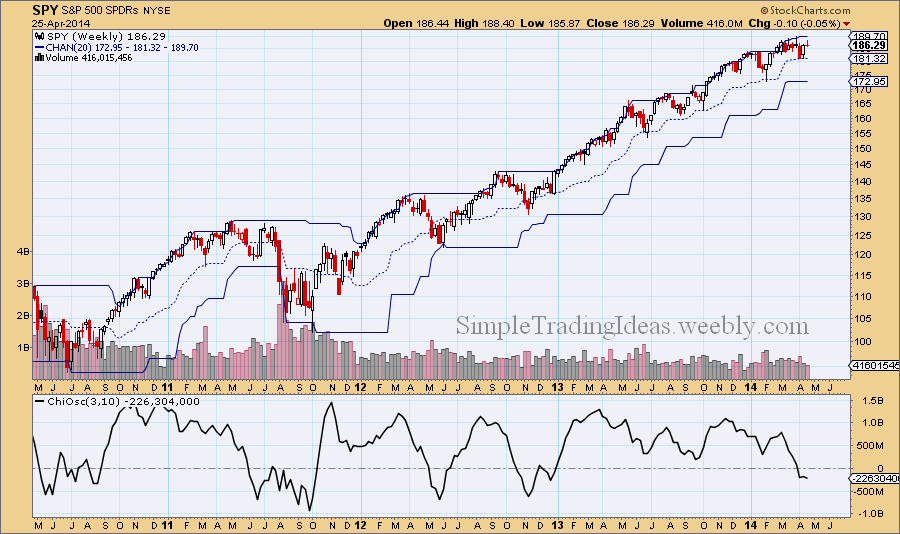
The Chaikin Oscillator measures the momentum of the Accumulation Distribution Line. The calculation is similar to the calculation of MACD but instead of the price it uses the Accumulation Distribution Line. It is an indicator of an indicator. The Chaikin Oscillator is the difference of the 3-period EMA and the 10-period EMA of the Accumulation Distribution Line. Similar to other momentum indicators, it is designed to anticipate directional change in the trend as momentum change usually precedes trend change. The calculation uses both the price and volume since it is based on the Accumulation Distribution Line. The Chaikin Oscillator gives buy/sell signals by bullish/bearish divergences and centerline crossovers. The chart below shows the weekly chart for SPY, the S&P 500 ETF with the Chaikin Oscillator in the indicator window (the chart also shows the 20-period Price Channels). There was a noticeable bearish divergence since last year Novermber and the Chaikin Oscillator finally crossed below zero at the end of March. That is considered a sell signal according the Chaikin Oscillator. The Accumulation Distribution Line is falling and selling pressure dominates.

 RSS Feed
