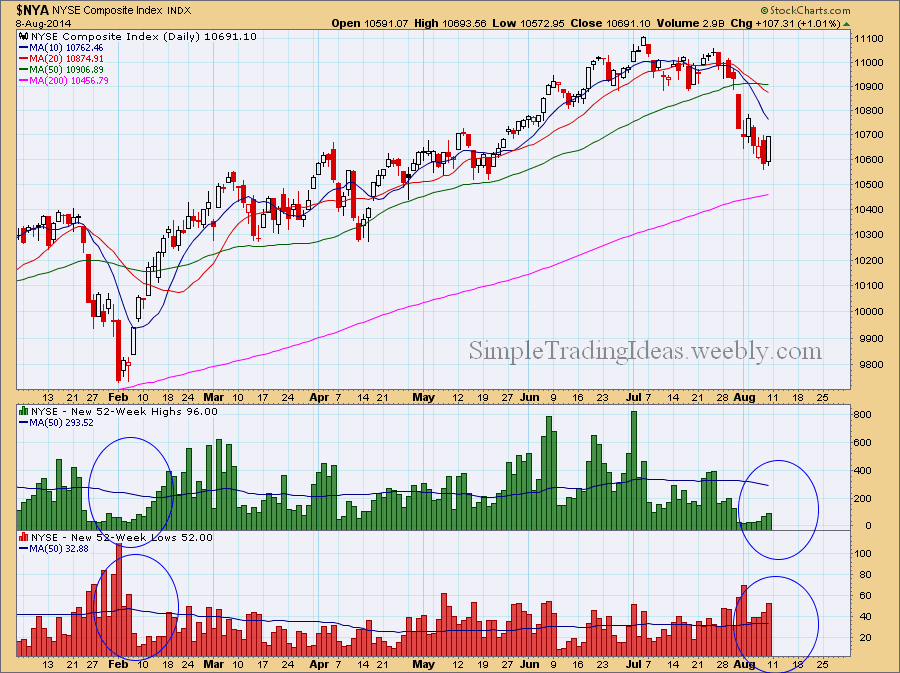
The daily charts below shows $NYA, the NYSE Composite Index. The indicator window shows the New 52-Week Highs and New 52-Week Lows of the NYSE. I am trying to use these breadth indicators to gauge the bottom of this pullback/correction. The New 52-Week Highs are still way under the 50-day SMA and the New 52-Week Lows are still above the 50-day SMA and increasing. There was a similar situation back in February, see the circled areas. I am still waiting until the New 52-Week Highs are increasing and eventually move above the 50-day SMA and the New 52-Week Lows move way below the 50-day SMA.
0 Comments
The daily chart below shows IWM, the Russell 2000 iShares, representing the small caps. As you notice the price closed below the 50-day SMA. The indicator window shows the Aroon trend indicator with Aroon Down (red) moving up to almost 100. Below that you can see the price relative to the S&P 500. Small caps are underperforming large caps.
$SPXA50R, the S&P 500 percent of stocks above their 50-day moving average seems to be stalled at the 40% area. In the fairly recent past $SPXA50R bounced back from this level several times as you can see it on the chart below and that would be bullish at least in the short term. In the background you can also see that these low levels correspond to short term bottoms on SPX, the S&P 500 large cap index chart.
The chart below shows the Fibonacci retracement levels relative to the move since late June. TRIX momentum oscilator and Aroon trend indicator below the chart shows bearish bias.
The weekly chart below shows SPY with the 2 period RSI and MACD. Notice that this is the second time this year when RSI(2) is below 30. MACD is below its signal line which is also sign of weakness.
The Accumulation Distribution Line is calculated from the current price and volume. It measures the cumulative flow of money into and out of the security, in this case the S&P 500 (SPY).
There are three steps to calculate ADL. First, calculate the Money Flow Multiplier which tells us the relationship of the current close to the high-low range. The Money Flow Multiplier fluctuates between +1 and -1. It’s positive when the close is in the upper half of the high-low range and negative when in the lower half. Second, multiply this by the volume which gives us the Money Flow Volume. Third, calculate a running total for the Money Flow Volume. Here are the 3 steps of the calculation: 1. Money Flow Multiplier = [(Close - Low) - (High - Close)] /(High - Low) 2. Money Flow Volume = Money Flow Multiplier x Volume for the Period 3. ADL = Previous ADL + Current Period's Money Flow Volume We can use ADL to confirm the price trend or look for bullish or bearish divergences. The chart below shows that both the price chart and ADL is moving down. This reinforces the current selling pressure. The indicator window also shows the 20-day SMA for ADL. ADL is currently below its 20-day SMA which is also bearish. Just like regular puts, debit put spreads can be in the money (ITM), at the money (ATM) and out of the money (OTM) depending on the strike prices relative to the security’s current price.
Here we are going to examine four different debit put spreads for SPY with August expiration date. SPY is currently trading at 161.28. The 167/164 and 165/162 spreads are in the money since both the long and short options have strike prices above the current price. The 163/160 spread is at the money since the long option’s strike price is above the current price and the short option’s strike price is below the current price. The 161/158 put spread is out of the money since both strike prices are below the current price. All spreads are 3 point wide. What I am interested is to find out how the strike prices affect the maximum profit, the breakeven point and the maximum loss. I also want to know the probabilities associated with the maximum profit, breakeven point and maximum loss. The table below shows the data I calculated and used and the chart summarizes the results. The table and the chart clearly shows that in the money debit spreads have much higher probability and even if the stock moves against you, you can still make money. You don’t have to be bearish to use this strategy. In the money debit spreads work well in neutral market conditions. After a long advance the market is ripe for a correction. This stage is very boring for a lot of traders and many of them decide to stay on the sideline. Trading this stage can be tricky since even though the market declines not all the stocks will decline. You could end up trading on the wrong side predicting a decline in the stock which will not necessarily happen.
The weakest stocks will decline of course, often ahead of the general market decline. The further these stocks go down the higher the probability that their fundamentals are relatively weak. Not only retail traders but institutions are selling these stocks as well. On the other hand there will be a number of stocks during this general downturn which will hold up relatively well. They might stay just below the 52-week high during this consolidation period or they might even slightly advance. Institutions refuse to lighten up on these stocks with strong fundamentals. These stocks which hold up real good during a correction could be the next Emerging Growth Stocks. These stocks usually break out before the market turns up. The chart below shows Wells Fargo (WFC) showing strong relative strength. As $SPX declines WFC refuses to decline. Notice that although MACD line is below the signal line it is still positive. Also On Balance Volume (OBV) is nicely grinding higher. This is just an example how to find buying opportunities during a market correction. Also notice that MACD is negative and below the signal line. The next support could be the 200-day SMA.
MSFT was already overbought in April and showed some weakness since then. A divergence was forming between the RSI indicator and the price chart. Prices were moving higher but RSI was moving lower. The price chart shows that MSFT clearly lost momentum and some kind of top was forming. Continue reading below the chart. One way to take advantage of a correction like this is to buy a Debit Put Spread. A Debit Put Spread consist of a long Put with a higher strike price and a short Put with a lower strike price. What we pay is the difference, a Net Debit.
Buying a Put and Selling another Put lowers the cost but there are other benefits too. The time decay and volatility is sort of neutralized since the long and short position cancels out each other. Even if the price doesn’t change time decay won’t take a bite out of your position. Another advantage whit debit spreads is that you will know ahead of time the Maximum Profit and the Break-Even Point at expiration. For as long as your position is open these parameters won’t change. Depending on how you choose the strike prices the Break-Even Point could be very close to the current price. This way even if the stock only slightly moves you can still make money. In the current example I used my Virtual Trading account to open this position. I bought 20 MSFT Sep 13 33/36 Put Spread for 1.33 Net Debit each. The total cost was 1.33x100x20 = $2660. The Maximum Profit = (36-33)-1.33x100x20 = $3340 which is 125%. The Break-Even Point is 36-1.33 = $34.67. I entered this position on 6/12/2013 when MSFT closed at $35.00. In this case as you can see if the price moves down more than 1% until September we are going make money. Today, when MSFT closed at $33.26 the value of this position is 1.83 for the total of $3660. It already made $1000 or 37% in 9 days. If this was real money in a real account I would probably exit the trade and take the profit. For now in my Virtual Account I will leave this trade open since I see further weakness during the next few weeks. |
Loading
Search Site
Links
Archives
September 2014
Categories
All
|