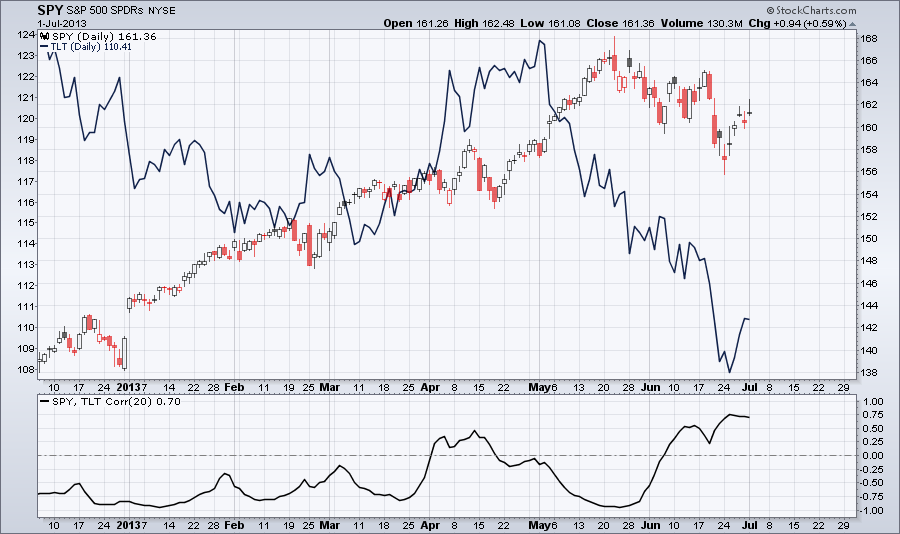
Long-term treasury bond ETF TLT is normally negatively correlated to the S&P 500. During the past couple of weeks this correlation turned positive. Soon this correlation will go back to negative. Either SPY or TLT is going to turn up.
| Simple Trading Ideas |
|
|
Long-term treasury bond ETF TLT is normally negatively correlated to the S&P 500. During the past couple of weeks this correlation turned positive. Soon this correlation will go back to negative. Either SPY or TLT is going to turn up.
0 Comments
 According to the SEC (Securities & Exchange Commission) any stock trading under $5 is a penny stock. Others consider stocks trading on the Pink Sheets and the Over The Counter Bulletin Boards (OTCBB) to be penny stocks. Micro-cap (market capitalization between 50 and 300 million) and nano-cap (market capitalization under 50 million) stocks can be also considered penny stocks.
Trading penny stocks is different than trading blue chip stocks. Just like with any other securities before you trade penny stocks you should learn about the risk they involve. Trading penny stocks has advantages and some disadvantages compared to blue chip stocks. First let’s look at the disadvantages: · Penny stocks considered riskier than stocks traded on the big exchanges. One reason is that to be listed on the Pink Sheets and the OTCBB requires less requirements. These companies are only obligated to disclose limited information. Some of these companies might be under bankruptcy. · Penny stocks are more volatile. · Liquidity can be a problem with penny stocks with low volume. · You can be a victim of a pump and dump scheme if you don’t recognize it. Penny stocks have some advantages too: · Due to volatility penny stocks can be a lot more profitable than blue chip stocks. · Profit is comparable with profit from trading options. · Penny stocks don’t expire unlike options. · Penny stocks don’t have time decay unlike options. · Penny stocks have little correlation to the major markets. · If you are a good stock picker you can find many good penny stocks on the Pink Sheets and OTCBB and some even on the Nasdaq and NYSE. If you decide to trade penny stocks don’t put all your eggs in one basket. You will always have winning trades but you will have losers too. When you buy penny stocks always use limit orders and use limit orders when you sell them. This way you don’t have to sit in front of your computer while the trade is on. All major US airlines are looking great in the past three months. 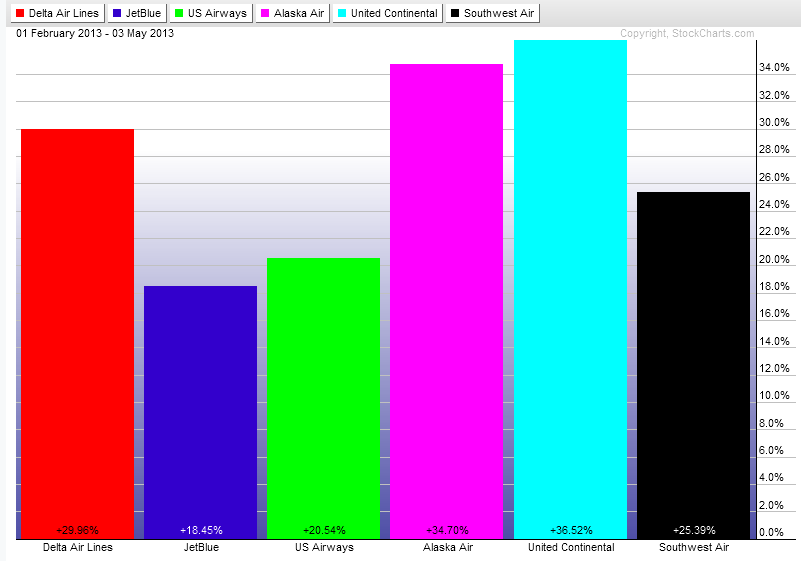
During times when the stock market is trending higher investors are willing to take more risk for greater returns. This is the time when most investors move their money into equities. This is the so called risk-on mode. During this time the less risky bond assets are not so popular. In a risk-on mode money is moving out of bonds into stocks. On the other hand when the smart money perceives the stock market too risky they move money from stocks into treasuries. This is the so called risk-off mode. As the market is going thru up-trends and corrections so are investors going thru risk-on and risk-off periods. This is the reason why the relationship between stocks and bonds can give indication about the market sentiment and especially market sentiment changes. The chart below shows SPY with the 20+ year treasury bonds TLT. Below the chart the correlation coefficient shows that stocks and bonds most of the times are negatively correlated. As you can see the smart money started to rotate money out of stocks into bonds ahead of a possible market correction. This gives a higher probability that a market correction will happen in the near future.  |
Loading
Search Site
Links
Archives
September 2014
Categories
All

|
 RSS Feed
