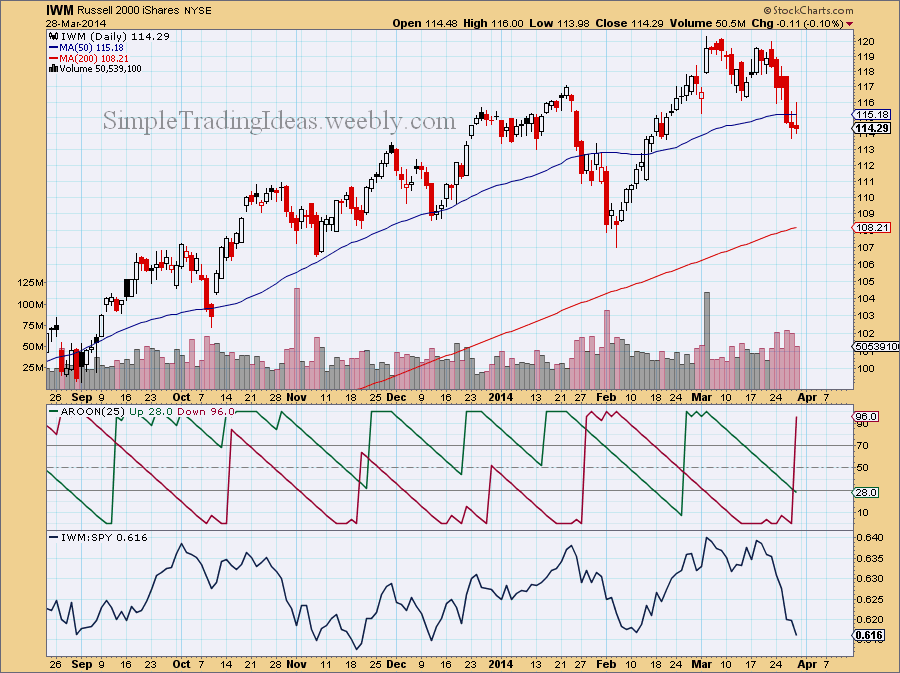
The daily chart below shows IWM, the Russell 2000 iShares, representing the small caps. As you notice the price closed below the 50-day SMA. The indicator window shows the Aroon trend indicator with Aroon Down (red) moving up to almost 100. Below that you can see the price relative to the S&P 500. Small caps are underperforming large caps.
0 Comments
The performance chart below shows the nine sectors of the S&P 500 with the S&P 200 ETF, SPY. As you can see SPY didn't go anywhere during the past month but four sectors, the financials, utilities, energy and consumer staples showed strength. On the downside health care and cyclicals where the weakest.
The daily chart below shows 18 different moving aveages for $VIX. 14 out of 18 moving averages are in the 14.65-15.08 narrow range. The moving averages are getting compressed. They will probably fan out soon one way or the other. Pressure is building up.
The Vortex Indicator is a unique directional indicator. The Vortex Indicator shows volatility-adjusted posotive trend movement and volatility-adjasted negative trend movement. The indicator oscillates above/below 1. During an uptren +VI is above -VI and during a downtrend -VI is above +VI. During a consolidation +VI and -VI moves in a narrow range. As you can see on the daily chart below that's what happening for SPY, and we are waiting to find out which Vortex Indicator is going to move higher.
The chart below shows VIX with a couple of 200-day Bollinger Bands. The difference is that the bands are calculated with different standard deviations, namely 2, 3 and 4 standard deviations. From the chart below my guess is that VIX is going to penetrate thru the 3 standard deviation band possibly the 4 standard deviation band which is barely visible on the chart (green). So VIX could go up to the 22-ish range.
If you read my last couple of posts than you know that it wasn’t a surprise that the market moved lower during this week. This is of course not the end of the World but the way I see it the correction is not over yet. Next week we will possible see further decline. Corrections like this give a good opportunity to trade volatility, namely VIX. You can’t trade directly VIX but there are plenty of VIX derivatives available. The easiest thing is to buy VIX calls during a market decline. There were good entry points last week, now probably it would be too late. Good timing is almost always the most important part of a good trade. If you are in a VIX trade, don’t get too greedy, realistically set resistance levels. The daily chart below shows SPY with MACD and StochRSI indicators. Both indicators show a bearish bias. From the chart below it looks like the correction could take another week and a half. The Februaty low or the 200-day MA could be a support or maybe both.
There are only 7 days left until expiration for near-term VIX options. If you compare the Implied Volatility Skew to the table posted on March 2, you can see that the Volatility Smile is just getting bigger. For deep in-the-money options the implied volatility is over 400 and for far out-of-money options is over 200.
$CPC, the CBOE Options Total Put/Call Ratio is slowly advancing. $CPC is a sentiment indicator showing the Put volume relative to the Call volume. It is increasing when more Puts are trading than Call options. This means that investors are expecting a bearish development in the future. Also notice below the chart that the correlation coefficient to the S&P 500 index is -.20 and turning up. Normally the 20-period correlation coefficient is less than -.50.
The daily chart below shows that $NYA, the NYSE Composite Index is moving higher but $NYMO, the NYSE McClellan Oscillator is moving lower. $NYMO a breadth indicator is calculated from the net advances on the New York Sock Exchange.
Normally there is a high correlation between $DAX, the German Sock Index and $SPX, the S&P 500 Large Cap Index. The correlation coefficient is usually close to 1. Since the end of February they have been moving in opposite direction. Is $DAX going to follow $SPX higher or $SPX is going to fall with $DAX? We will see it soon.
|
Loading
Search Site
Links
Archives
September 2014
Categories
All
|