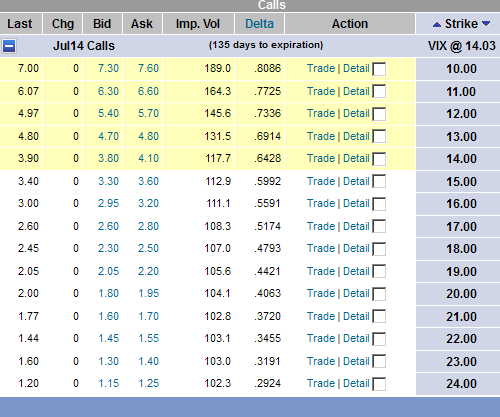
I am posting these tables for my reference. The first table shows VIX call options with March expiration and the second table shows VIX call options with July expiration. As you can see the front month and the back moth shows different volatility skews. Volatility skew means that the Implied Volatility changes with the change in strike prices. The front month shows the Volatility Smile and the back month shows Reverse Skew.
0 Comments
$BPSPX is the S&P 500 Bullish Percen Index. It is a breadth indicator and is calculated from the number of stocks having Point & Figure buy signals within the index, in this case the S&P 500. If $BPSPX reaches new highs with the index, $SPX that's bullish. As you can see on the chart below $SPX reached new highs but $BPSPX failed to reach new highs. The chart below also shows that the 200-day moving average is curving down and both the 20-day and 50-day moving averages are below the 200-day moving average.
VXX, the VIX Short--Term Futures ETN started to outperform the S&P 500 index, SPX this year. Both of them have been moving higher from the second half of February as you can see on the daily chart below. Below the chart you can see that VXX out performs VIX too. The relative strength of VXX suggest that there could be a volatility spike in the near future.
SPY, the S&P 500 SPDR has been moving higher since the beginning of February as you can see on the daily chart below. The Money Flow Index (MFI) above the chart moved into overbought territory. The Vortex Indicator (VTX) below the chart, a trend indicator shows that the trend is losing momentum. The green line is turning down.
|
Loading
Search Site
Links
Archives
September 2014
Categories
All
|