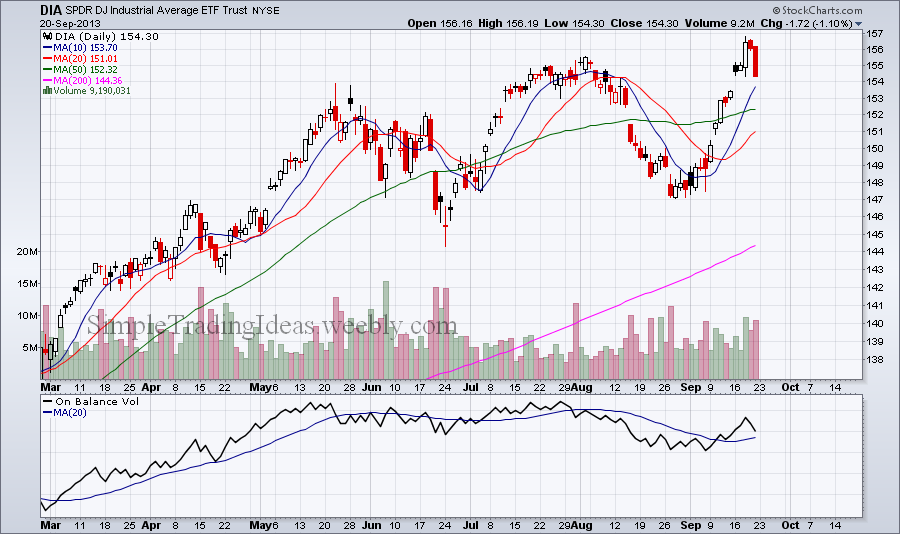
DIA, the Dow Jones Industrial Average ETF represents large caps. DIA reached higher highs but On Balance Volume, OBV has been moving lower. This is a bearish divergence and could be an alert for price or trend reversal.
| Simple Trading Ideas |
|
|
DIA, the Dow Jones Industrial Average ETF represents large caps. DIA reached higher highs but On Balance Volume, OBV has been moving lower. This is a bearish divergence and could be an alert for price or trend reversal.
0 Comments
$SPXA150R is the S&P 500 Percent of stocks above their 150-day moving average. $SPXA150R is a breadth indicator. The chart below shows the 5-day and 20-day EMA with $SPX in the background for comparison. There is a noticeable divergence between the two charts. $SPXA150R started to decline before $SPX. This is a bearish divergence which could be a sign of a medium term trend change. 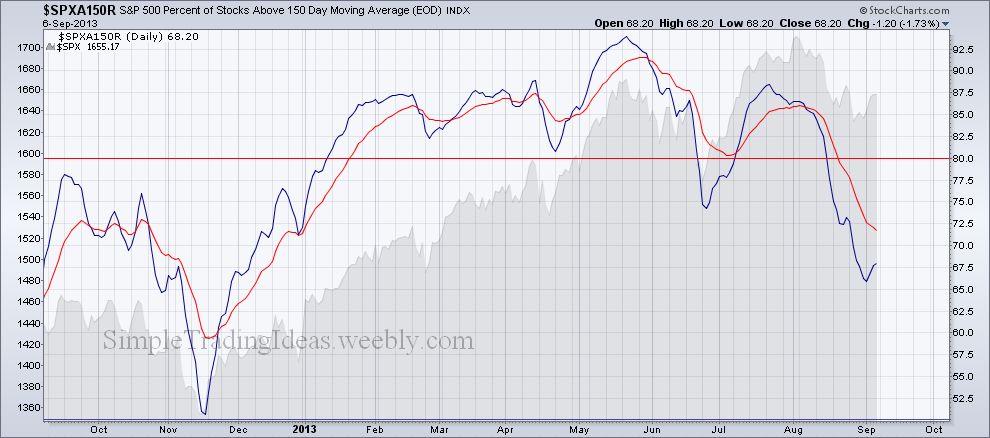
In my earlier post about three and a half weeks ago I pointed out that a divergence was developing. The S&P 500 was moving higher but the number of stocks above their 50-day SMA was moving lower. It means that fewer stocks participated in the price advance and more stocks crossed below the 50-day SMA in the S&P 500. S&P 500 was moving higher today too but $SPXA50R had only a lower high as you can see on the chart below. I will keep a close eye on this chart the next couple of weeks to see if $SPXA50R will plunge below 60%. 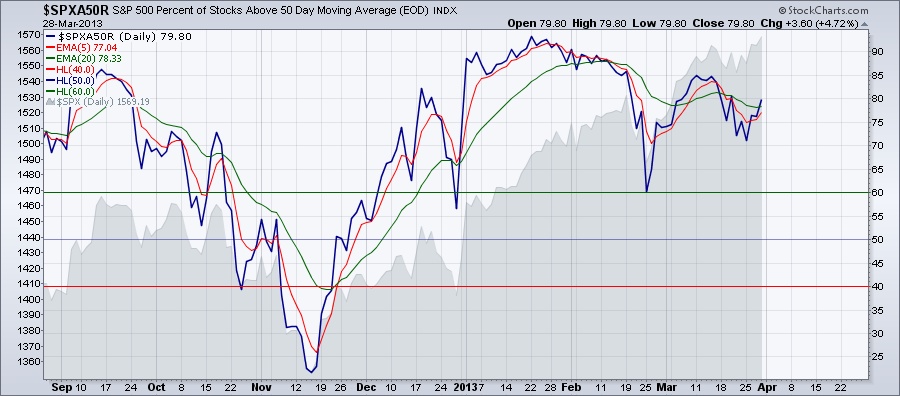
I posted earlier about this observation here. As you can see on the chart below SPY and EEM (emerging markets) have been closely correlated except since the beginning of this year. Most of the time the correlation was close to 1.0. This year the correlation turned negative for a longer period of time. Something has to give. We will find out in a month or two. 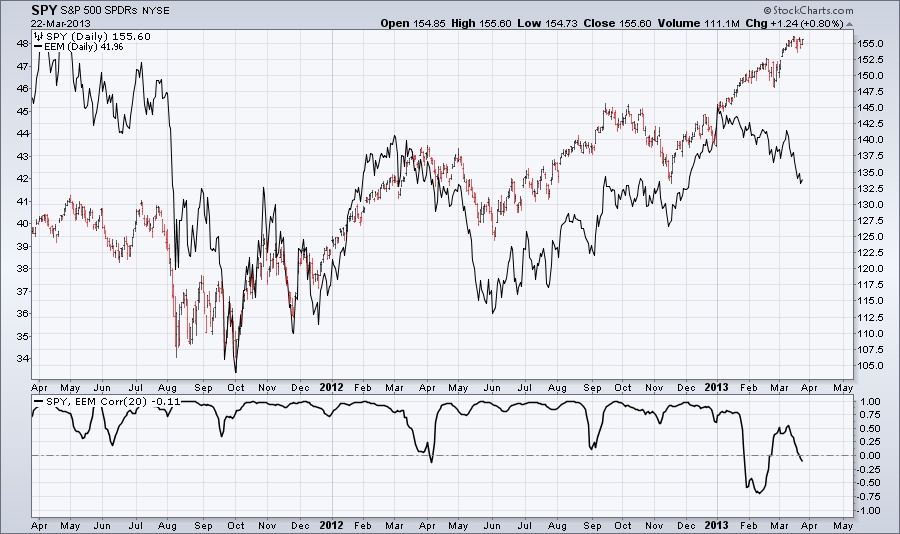
The Money Flow Index (MFI) is calculated both from the price and volume. It's a momentum oscillator that moves between 0 and 100. MFI above 80 considered overbought and below 20 considered oversold. During a strong uptrend MFI can stay overbought and during a strong downtrend it can stay oversold for a longer period of time. The Money Flow Index can be interpreted similar to RSI (Relative Strength Index) but the big difference is volume. Although the two indicators look somewhat similar they are not collinear. The Money Flow Index is most useful indentifying reversals and price extremes. Bearish and Bullish divergences can be used to indentify reversals. The chart below shows SPY with the 14 priod MFI. i added the 14 period RSI too so you can see that there is a difference. As you can see a bearish divergence took place between the oscillator and the price chart. SPY moved higher but MFI moved the opposite direction. We should be able to see during the next couple of weeks if this divergence will give a good signal. 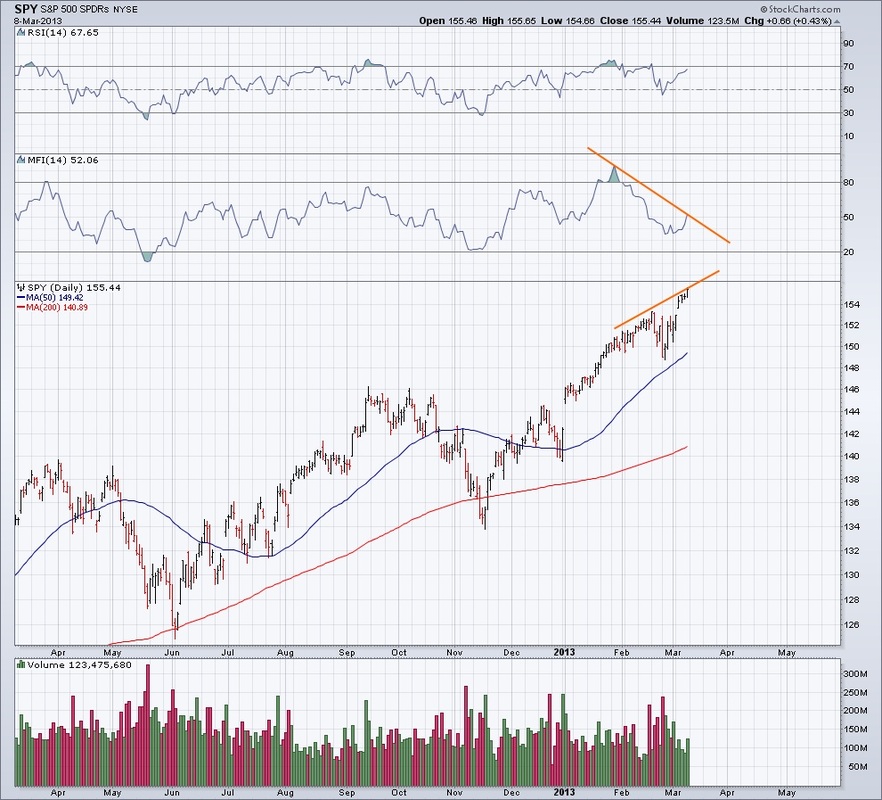 |
Loading
Search Site
Links
Archives
September 2014
Categories
All

|
 RSS Feed
