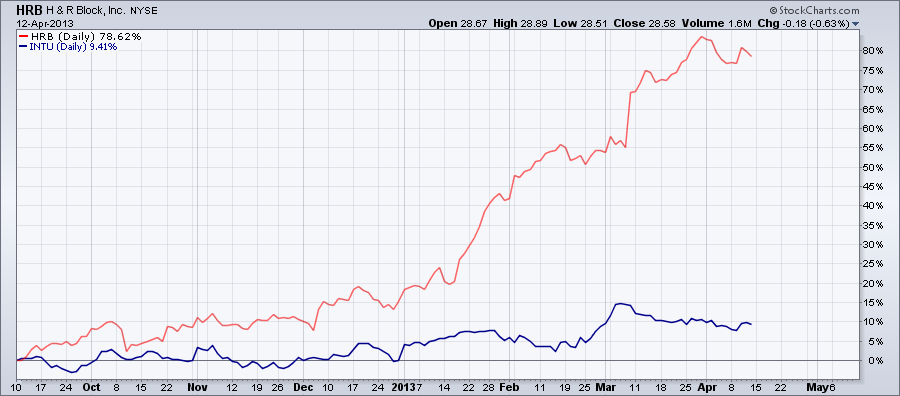
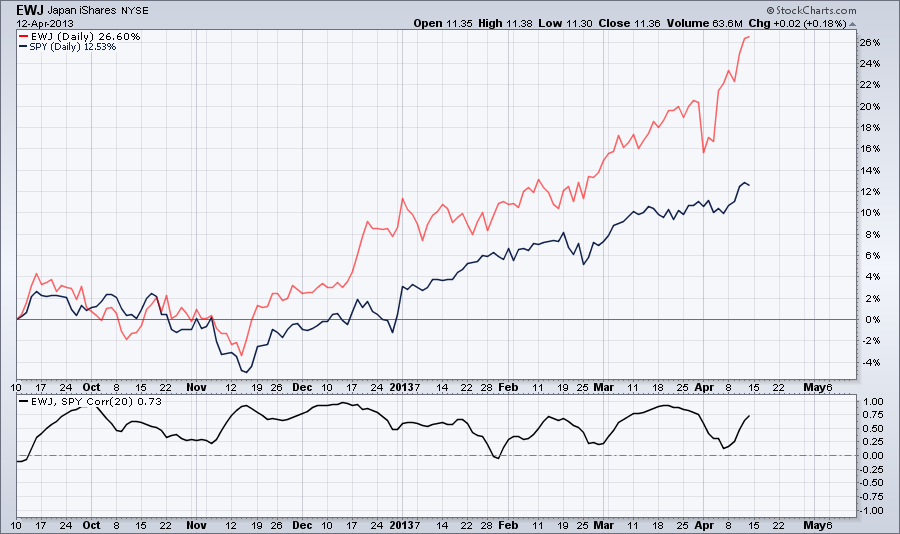
- Underlying security – How much we know about the underlying security and how confident we are that it's going to move in the expected direction by the expected amount. Also we have to find out how that sector is doing and what is the correlation to the overall market.
- Strike price – How far is the strike price from the current price? Out-of-Money options seem to be cheap but the risk is higher because there is a bigger chance that they will expire worthless. That means you can lose 100% of your investment.
- Expiration date – It's tempting the buy with expiration date in a month or two because they are cheaper. Again, if the underlying stock doesn't move in favorable direction you can lose all your money.
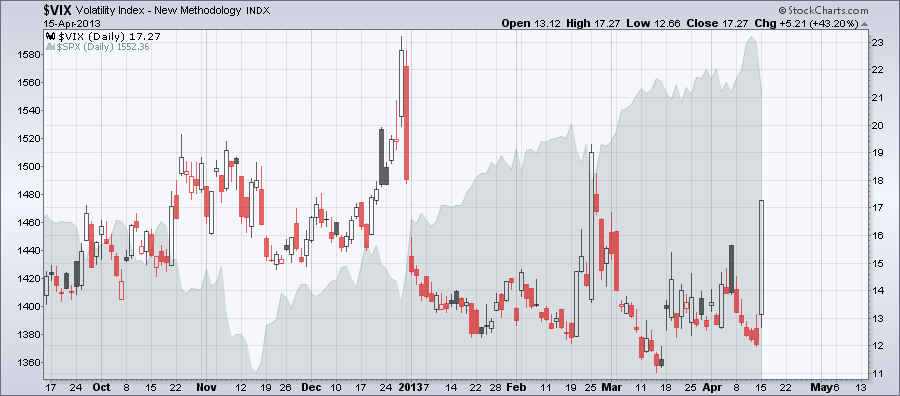
- Volatility – High volatility makes option prices expensive. If volatility drops so does the option price and you can lose money even if the underlying price doesn't change. It's better to buy options with low implied volatility.
- Liquidity – The problem with thinly traded securities and options are that it could be hard to get in and out of positions.
- Bid Ask spread – Relatively high bid ask spread compared to the option price can be costly. You can lose money just because this spread. The bid ask spread is usually wider for thinly traded options.
- Commission – If you don't invest a lot money the commission could be proportionally high to the option price. If the commission is 10% of the option price you have to make at least 20% to get even (10% to get in and 10% to get out of the trade)
- Events, News – Any news or reports are coming out during the time I want to hold the position and that could affect the price, such as earnings, merger and acquisition, etc?
Sometimes it's tempting to quickly buy a cheap call or put option for extra profit. But it's easy to make a mistake and lose money if we don't consider the followings:
0 Comments
SSO is the ProShares Ultra S&P 500 Fund and SDS is the ProShares Ultra Short S&P 500 Fund. With these two ETFs you can take advantage when the market moves up or down. Buy SSO when the spread between the bottom two charts narrows and Buy SDS when it widens. The chart below is a 15 Min charts so it's only for short term trading. Currently the spread between SSO and SDS narrows.
$NYSI is the McClellan summation index of the NYSE . It’s a breadth indicator and is calculated from the McClellan Oscillator. It is simple the running total of the McClellan Oscillator. $NYSI rises when $NYMO the McClellan Oscillator of the NYSE is positive and falls when it’s negative. Remember $NYMO is calculated from the net advances on the NYSE.
The Summation Index is also an oscillator, it moves above and below the zero line. When the Summation Index stays above zero and rising it’s bullish and when falling and below zero is bearish. The McClellan Oscillator can be used for shorter-term trading and the Summation Index for medium and long-term trading. Divergences between the Summation Index and the Index itself can warn us of a possible correction or trend reversal. The chart below shows the Summation Index for the New York Stock Exchange with the NYSE index. There has been a divergence between the two since February. $NYSI is declining and stays below the 5 period simple moving average. The Stochastic Oscillator is a momentum indicator which tracks the current location relative to the high-low range in a set number of periods. As a momentum indicator it changes direction before price. The Stochastic Oscillator is calculated as follows:
%K = (Current Close - Lowest Low)/(Highest High - Lowest Low) * 100 The StochRSI is the Stochastic calculation applied to RSI. This makes StochRSI an indicator of an indicator. The calculation is the following: StochRSI = (RSI - Lowest Low RSI) / (Highest High RSI - Lowest Low RSI) StochRSI moves between 0 and 1. This momentum indicator can be used to identify trends, trend reversals, oversold and overbought conditions. The chart below shows the weekly chart for SPY with StochRSI. As you can see StochRSI moved to 0 but the 5 period EMA of StochRSI is still above 0.5. When in previous instances SPY moved to 0 it signaled the beginning of a medium-term correction. Also notice heavier selling volume. The market carpet below shows the performance of the 9 sectors in the past 15 days. As you can see the defensive sectors are the winners and the energy, materials and the industrials sectors are the losers.
Yes, it looks like. $VIX moved up over 43%. If you trade $VIX serious money can be made (sometimes). Not recommended to inexperienced traders.
As you can see on the performance chart below EWJ is outperforming SPY but they are still positively correlated.
|
Loading
Search Site
Links
Archives
September 2014
Categories
All
|