$NYSI is the McClellan summation index of the NYSE . It’s a breadth indicator and is calculated from the McClellan Oscillator. It is simple the running total of the McClellan Oscillator. $NYSI rises when $NYMO the McClellan Oscillator of the NYSE is positive and falls when it’s negative. Remember $NYMO is calculated from the net advances on the NYSE.
The Summation Index is also an oscillator, it moves above and below the zero line. When the Summation Index stays above zero and rising it’s bullish and when falling and below zero is bearish.
The McClellan Oscillator can be used for shorter-term trading and the Summation Index for medium and long-term trading.
Divergences between the Summation Index and the Index itself can warn us of a possible correction or trend reversal.
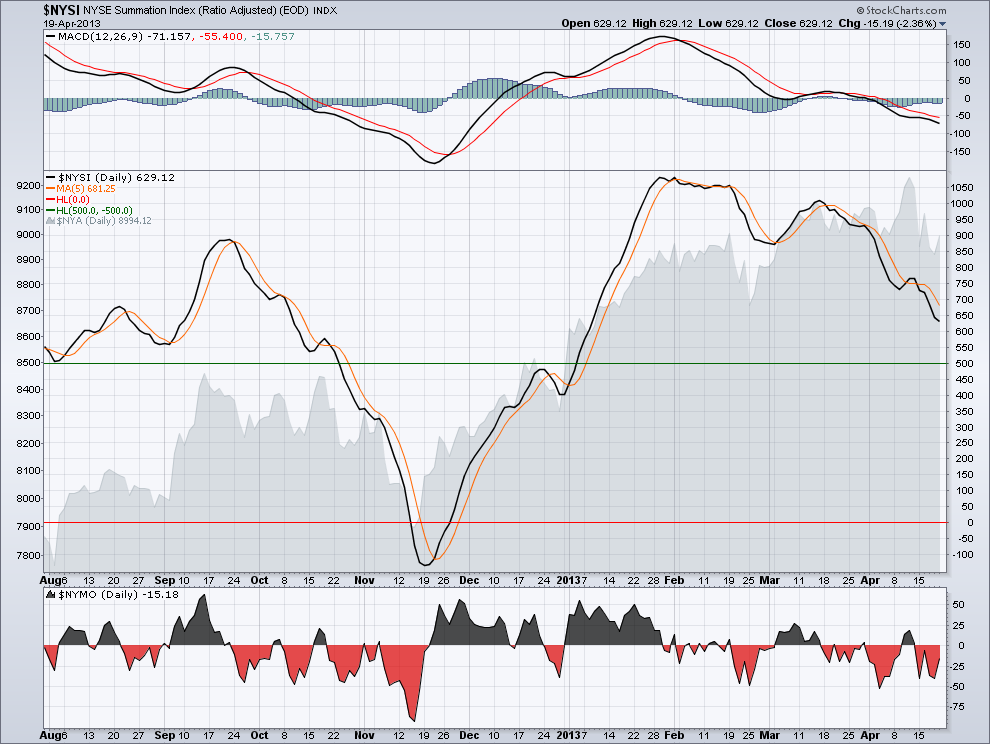
The chart below shows the Summation Index for the New York Stock Exchange with the NYSE index. There has been a divergence between the two since February. $NYSI is declining and stays below the 5 period simple moving average.
The Summation Index is also an oscillator, it moves above and below the zero line. When the Summation Index stays above zero and rising it’s bullish and when falling and below zero is bearish.
The McClellan Oscillator can be used for shorter-term trading and the Summation Index for medium and long-term trading.
Divergences between the Summation Index and the Index itself can warn us of a possible correction or trend reversal.
The chart below shows the Summation Index for the New York Stock Exchange with the NYSE index. There has been a divergence between the two since February. $NYSI is declining and stays below the 5 period simple moving average.

 RSS Feed
