The McClellan oscillator is a breadth indicator calculated from advances and declines for the New York Stock Exchange or the NASDAQ. First the Ration Adjusted Net Advance is calculated:
RANA = (Advances – Declines)/ (Advances + Declines)
Then the 39-day EMA and 19-day EMA is calculated. Finally the 39-day EMA is subtracted from the 19-day EMA. This final calculation makes the McClellan indicator a momentum indicator similar to MACD.
The McClellan indicator oscillates between positive and negative territory, positive being bullish and negative being bearish. In a strong uptrend it can stay positive for a longer period of time and negative in a strong downtrend. Divergences can be used for the McClellan oscillator just like for MACD.
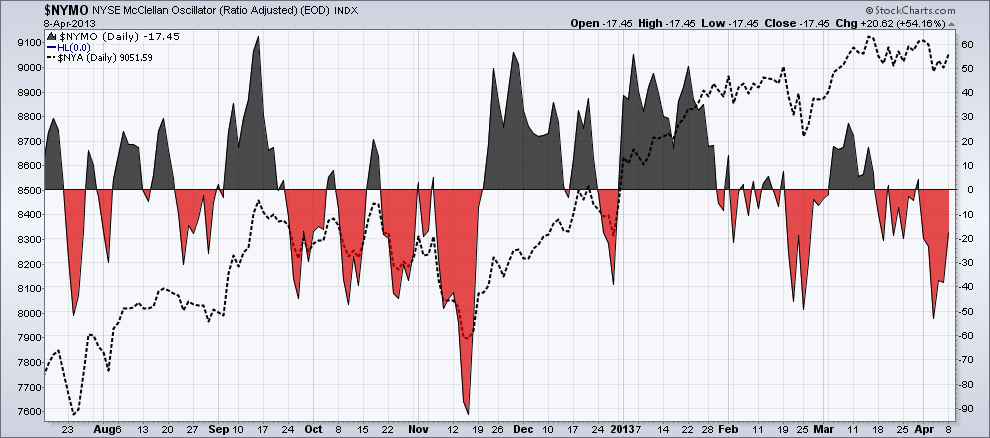
The chart below shows the McClellan oscillator for the NYSE. If the S&P 500 would have a McClellan oscillator it would be probably similar. As you can see the McClellan oscillator is currently in the red (negative) area, which is bearish. Also there was a noticeable divergence earlier in March when the market moved higher but $NYMO only reached a lower high.
RANA = (Advances – Declines)/ (Advances + Declines)
Then the 39-day EMA and 19-day EMA is calculated. Finally the 39-day EMA is subtracted from the 19-day EMA. This final calculation makes the McClellan indicator a momentum indicator similar to MACD.
The McClellan indicator oscillates between positive and negative territory, positive being bullish and negative being bearish. In a strong uptrend it can stay positive for a longer period of time and negative in a strong downtrend. Divergences can be used for the McClellan oscillator just like for MACD.
The chart below shows the McClellan oscillator for the NYSE. If the S&P 500 would have a McClellan oscillator it would be probably similar. As you can see the McClellan oscillator is currently in the red (negative) area, which is bearish. Also there was a noticeable divergence earlier in March when the market moved higher but $NYMO only reached a lower high.

 RSS Feed
