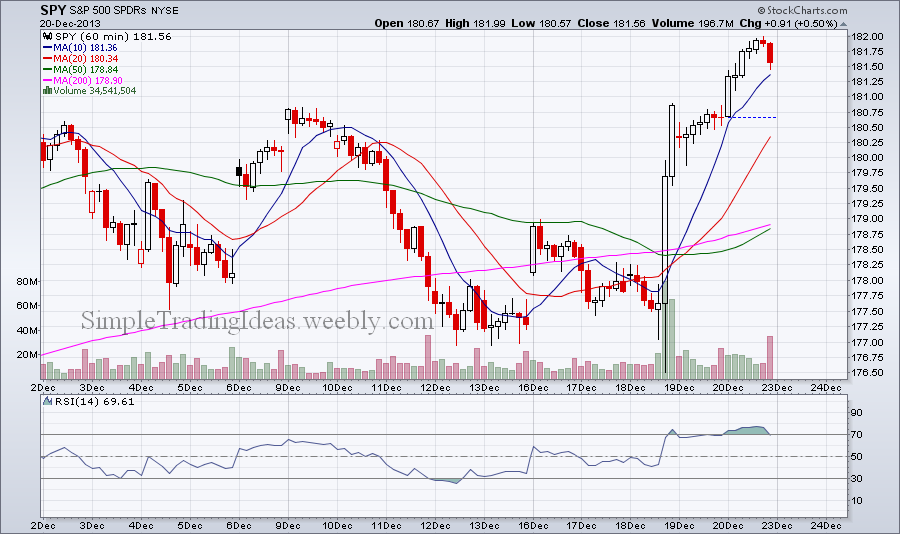
Below you can see the 60 minute chart for SPY with the 14 period RSI below the chart. Within the last two days of last week RSI moved above 70 and became overbought. Notice that the last candle shows incresed selling pressure at the end of the trading day.
0 Comments
Below you can see the daily candlestick charts for DAI, SPY, IWM and QQQ. Click on Play or the Arrows to see the other charts. The daily chart for SPY shows that yesterday's red candlestick and today's white candlestick completed a piercing pattern. In a piercing pattern a white candlestick follows a red candlestick both of them having relatively large bodies. It's a short term bullish reversal pattern. Today's white candlestick opened below yesterday's close and closed above the midpoint of yesterday's red candlestick. That's what makes these two candles a piercing pattern. Also notice that today's white candle found support on the 50-day SMA. As I mentioned this could be only a short term bullish reversal.
|
Loading
Search Site
Links
Archives
September 2014
Categories
All
|