• Blog
  • Interesting Articles
  • The Smart Option Trader
  • Charting
  • Contact
  • About
  • Disclosure
Simple Trading Ideas
"A trading plan is just words until you act on it."

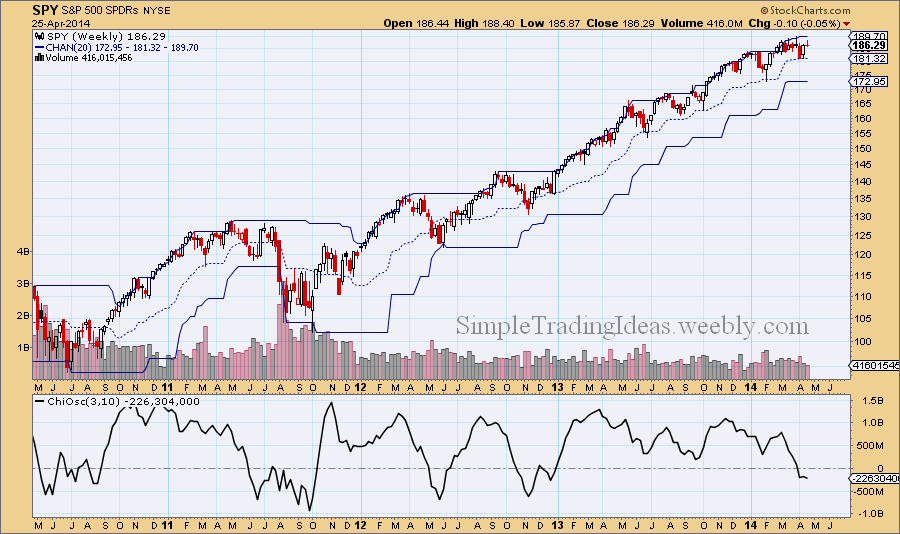
$SPY - Chaikin Oscillator Gives Sell Signal on Weekly Chart

4/26/2014

0 Comments

 
The Chaikin Oscillator measures the momentum of the Accumulation Distribution Line. The calculation is similar to the calculation of MACD but instead of the price it uses the Accumulation Distribution Line. It is an indicator of an indicator. The Chaikin Oscillator is the difference of the 3-period EMA and the 10-period EMA of the Accumulation Distribution Line. Similar to other momentum indicators, it is designed to anticipate directional change in the trend as momentum change usually precedes trend change. The calculation uses both the price and volume since it is based on the Accumulation Distribution Line. The Chaikin Oscillator gives buy/sell signals by bullish/bearish divergences and centerline crossovers. The chart below shows the weekly chart for SPY, the S&P 500 ETF with the Chaikin Oscillator in the indicator window (the chart also shows the 20-period Price Channels). There was a noticeable bearish divergence since last year Novermber and the Chaikin Oscillator finally crossed below zero at the end of March. That is considered a sell signal according the Chaikin Oscillator. The Accumulation Distribution Line is falling and selling pressure dominates.

Picture
0 Comments


Leave a Reply.

    Loading

    Search Site

    Links

    SmartTradingIdeas
    Save $150 off all Surface Pro 3 devices! Eligible for university-level students who are enrolled in an academic institution and are able to verify with a .edu email address. Valid 8.3 – 9.3.14.
    Microsoft Store
    Download, compare & review popular software directly from Microsoft.

    Archives

    September 2014
    August 2014
    July 2014
    June 2014
    May 2014
    April 2014
    March 2014
    February 2014
    January 2014
    December 2013
    November 2013
    October 2013
    September 2013
    August 2013
    July 2013
    June 2013
    May 2013
    April 2013
    March 2013

    Categories

    All
    Advance-decline
    Alternative Assets
    Asian Markets
    Bear Market
    Bollinger Bands
    Bonds
    Breadth Indicator
    Breadth Indicator
    Bull Market
    Candlesticks
    Chart Patterns
    Correction
    Correlation
    Cycle Analysis
    Cycles
    Divergence
    Diversification
    Eem
    Efa
    Elliott Waves
    Emerging Growth Stocks
    European Markets
    Fibonacci
    Financial News
    Futures
    Gold
    Insider Trading
    Keltner Channels
    Large Caps
    Market Carpet
    Market Correction
    Market Outlook
    Market Outlook
    Mid Caps
    Momentum Indicator
    Moving Average Ribbon
    Options
    Option Strategy
    Penny Stocks
    Pivot Points
    Put/Call Ratio
    Risk/Return
    Sector Performance
    Sector Rotation
    Sectors
    Sentiment Indicator
    Small Caps
    Spy
    Stocks
    Technical Analysis
    Technical Indicators
    Trading Advice
    Trading Ideas
    Us Dollar
    Virtual Trading
    Vix
    Volatility
    Volatility Chart
    Volatility Skew
    Yield Curve

    Picture

    RSS Feed


Powered by Create your own unique website with customizable templates.