I mentioned in a previous post that there are basically for types of technical indicators. One of them is volatility indicators. One way to add volatility indicator to your chart is to use Bollinger Bands.
Bollinger Bands consist of a middle band and two outer bands. The middle band is a simple moving average, usually the 20-period SMA. The outer bands are usually set 2 standard deviation above and below the middle band. The bands narrow when volatility decreases and widen when volatility increases.
The Bollinger Band Width indicator focuses only on the difference between the upper and lower band. A percentage value is calculated. The Bollinger Band Width helps us to identify periods when the volatility level is very low, prices are flat. This is called the squeeze. Periods of very low volatility are usually followed by periods of high volatility. After a squeeze prices can break above the upper band or below the lower band. Usually these breaks are strong.
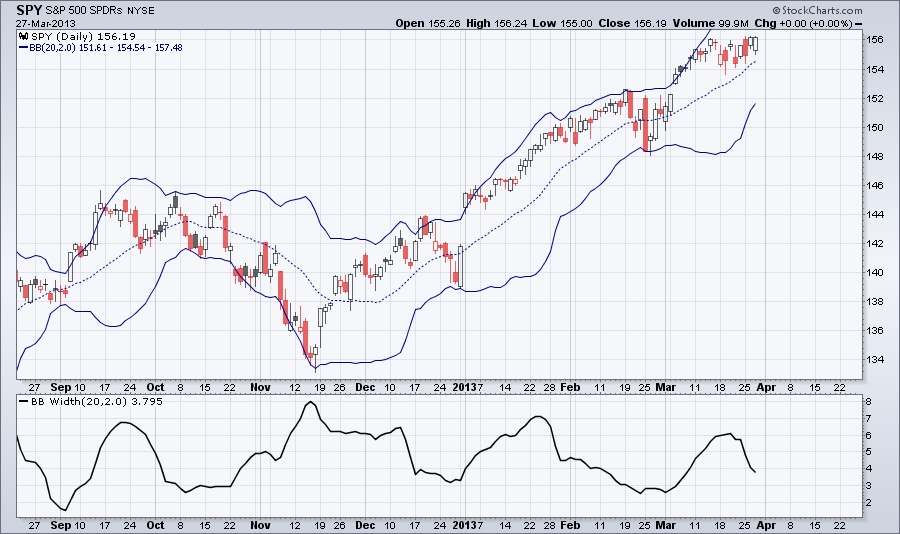
The chart below shows SPY with the Bollinger Bands and the Bollinger Band Width indicator. As you can see right now the bands are narrowing. Also prices are moving away from the upper band.
Bollinger Bands consist of a middle band and two outer bands. The middle band is a simple moving average, usually the 20-period SMA. The outer bands are usually set 2 standard deviation above and below the middle band. The bands narrow when volatility decreases and widen when volatility increases.
The Bollinger Band Width indicator focuses only on the difference between the upper and lower band. A percentage value is calculated. The Bollinger Band Width helps us to identify periods when the volatility level is very low, prices are flat. This is called the squeeze. Periods of very low volatility are usually followed by periods of high volatility. After a squeeze prices can break above the upper band or below the lower band. Usually these breaks are strong.
The chart below shows SPY with the Bollinger Bands and the Bollinger Band Width indicator. As you can see right now the bands are narrowing. Also prices are moving away from the upper band.

 RSS Feed
