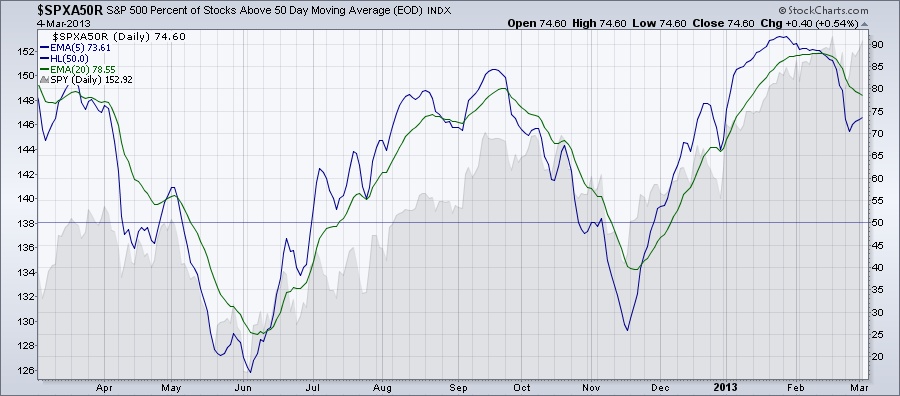
$SPXA50R is a breadth indicator, it measures the percentage of stocks in the S&P 500 index above their 50-day SMA (Simple Moving Average). If this indicator is above 50, it means that more than half of the stocks in the S&P 500 are above their 50-day SMA. If $SPXA50R is greater than 50 and is increasing that's bullish. That means that the number of stocks in the S&P 500 index above their 50-day SMA is increasing. The opposite would be bearish. $SPXA50R oscillates between 0 and 100 but never really reaches the extreme limits. When this indicator getting close to the extreme limit that's an indication of a possible reversal in the Market. If the long-term indicators a bullish this would indicate a short or medium-term correction. So how $SPXA50R looks like today. On the chart below you can see $SPXA50R during the past 12 months with 5-day EMA (Exponantial Moving Average) and the 20-day EMA. Behind this indicator the gray area is SPY. Obviously the two are closely correlated. You can see three peaks and two troughs as $SPXA50R cycled during this period of time. As you can see $SPXA50R is turning down again and the 5-day EMA already crossed below the 20-day EMA.

 RSS Feed
