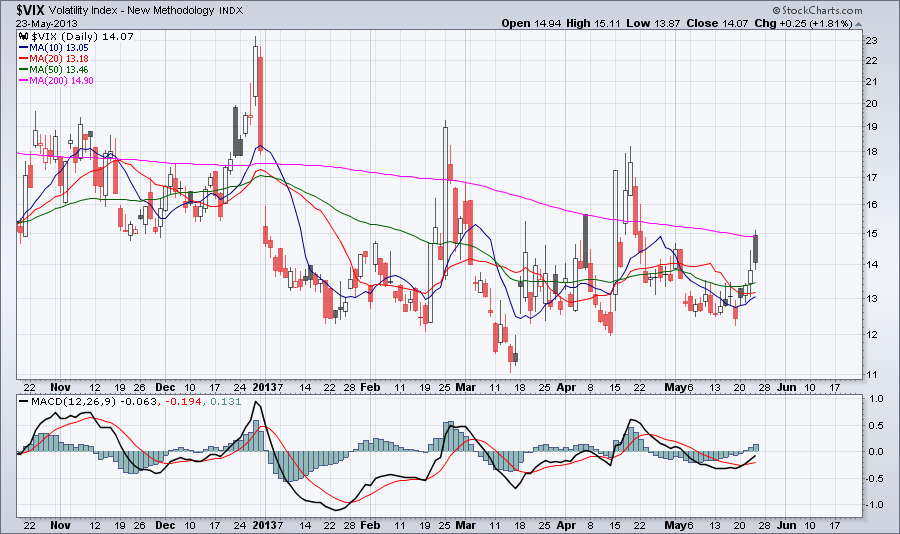
When volatility falls to a low level Bollinger Bands are narriwing as you can see on the chart below. This is called the Squeeze. Usually periods of low volatility are followed by periods of high volatility. Narrow bands can foreshadow a significant move either up or down. Since VIX is already on low level this move most likely will be a move higher.
0 Comments
The weekly chart below shows how VIX and MACD are slowly moving higher. Also notice that VIX touched the 200-period SMA several times during the past couple of years.
The "fear index" suggest that investors feel comfortable with the general market. From the chart below it looks like VIX will go even lower. The TRIX momentum oscillator and Aroon trend indicator reinforces this observation.
Below is the volatility chart for the Gold SPDR, GLD with the price chart for the same time period. Historical volatility and implied volatility is back in the lower range we haven't seen since June. It's easy to notice a negative correlation between implied volatility and the price chart. Also notice how the two converged since the beginning of August. Another thing I would notice is that implied volatility is moving slightly higher and crossed above historical volatility. The question is at what point they will diverge again and whether prices will move further up or decline.
Option traders and often stock traders use volatility charts all the time. The reason is that volatility plays an important role in option pricing, and current volatility levels can help to predict future price movements.
Volatility tells us how fast a stock changes in price. Volatility itself is not going to tell us which direction prices are going to move. Faster moving stocks, either up or down, have higher volatility, slower moving stocks have lower volatility. There are two types of volatility that are important to know. Historical Volatility or HV is telling us about past price movements during a certain period of time. HV is the annualized standard deviation of past stock price movements. There is statistical formula which gives us Historical volatility. It can be calculated for the past 10, 20, 30, 60, 90 or any number of days. It helps to compare shorter term HV with longer term HV. This will tell us recent price movements. Implied Volatility on the other hand is not calculated from past data, it is the option market’s prediction about future price movement. Implied Volatility constantly changes and that affects option prices. With increased Implied Volatility both calls and puts get more expensive. Implied Volatility indicates a one standard deviation move over a course of a year expressed as a percentage of the stock price. If a stock is currently trading at $50.00 and IV, the Implied Volatility is 40% than the one standard deviation move would be + or - $20.00 over the next 12 months. Historical and Implies Volatility are constantly change and most of the time they are different. They move apart and at some point they converge. Volatility Charts show the movement of Historical and Implied Volatility. The one thing we can notice from volatility charts is that volatility moves in a range. Volatility is not trending for a long period of time unlike most stocks do. When Implied Volatility is in the lower range options tend to be cheap and in the upper range they are expensive. Below is the Volatility Chart for SPY. Although Historical Volatility is still low, Implied Volatility is moving higher. Option traders are expecting a bigger price movement for SPY, or the S&P 500. There is also a chart included so you can compare volatility movements with price movements during the same period of time. VIX the volatility index could move higher soon. See the chart below with MACD and the 14 petiod StochRSI. It looks like MACD wants to cross above the signal line and StochRSI moved above 0.5.
There are different ways to measure volatility of a security. A popular volatility indicator is Average True Range. Some volatility indicators are calculated from the current high and low, ATR goes further and takes into consideration if there was a gap up or down from the previous day. ATR is calculated from the True Range. The True Range is the greatest of the following:
ATR can be used for trading to confirm price moves up or down. Powerful prices moves will result in increasing ATR. ATR can also be used to measure the strength of a reversal. It can be helpful to confirm the beginning of a downtrend. The chart below shows SPY with the ATR volatility indicator below the price chart. Notice how ATR has been increasing since the middle of May and broke out at the beginning of June. Risk is part of our everyday life. You take a risk when you drive your car, fly an airplane, move away from your home, you gamble, start a business, buy a house or buy stocks or any other asset types. By definition risk is the outcome which could be different what you expected. Think about a business where you can’t find customers, or a new home where your basement gets flooded every time there is heavy rain. When it comes to investment you can lose portion or all of your money. When we talk about risk we usually talk about negative outcome. You have to learn how much risk you can take. It depends on your personality, your experience, your age, your responsibilities. Don’t take more risk than what you can handle. Not only you can lose all your money but it can ruin your health and your relationships. Some people hate to take any risk some people love to take risks (which could be dangerous too) In the world of investing there are different types of risks. The main risks are classified as: · Systematic Risk is when a large number of assets are affected. A major political event can trigger one. It’s harder to protect yourself from this class of risk. · Unsystematic Risk when only a specific stock or a small number of stocks are affected. An earnings report, retail sales report, oil inventories can trigger one. Other types or risks are Credit Risk, Country Risk, Foreign-Exchange Risk, Interest Rate Risk, Political Risk and Market Risk. Risk is the reason why prices move, without risk it would be hard to make money with any investment. We measure risk with volatility. The higher the volatility the bigger market moves are expected. You take a bigger risk when you buy assets with higher volatility. Volatility can be measured with standard deviation. The higher the risk the higher the return could be but the losses could be bigger too. For example buying options is riskier than buying stocks or buying leveraged ETFs is riskier than buying unleveraged ETFs. You can protect your portfolio from various risks with diversification but you can never completely eliminate it. Diversification means buying at least 10-12 different securities from different asset classes, such as stocks, options, bonds, gold, real estate, currency and keep some cash too. The 200-day moving average acted as resistance but notice that the MACD line crossed avobe the MACD silgnal line.
|
Loading
Search Site
Links
Archives
September 2014
Categories
All
|