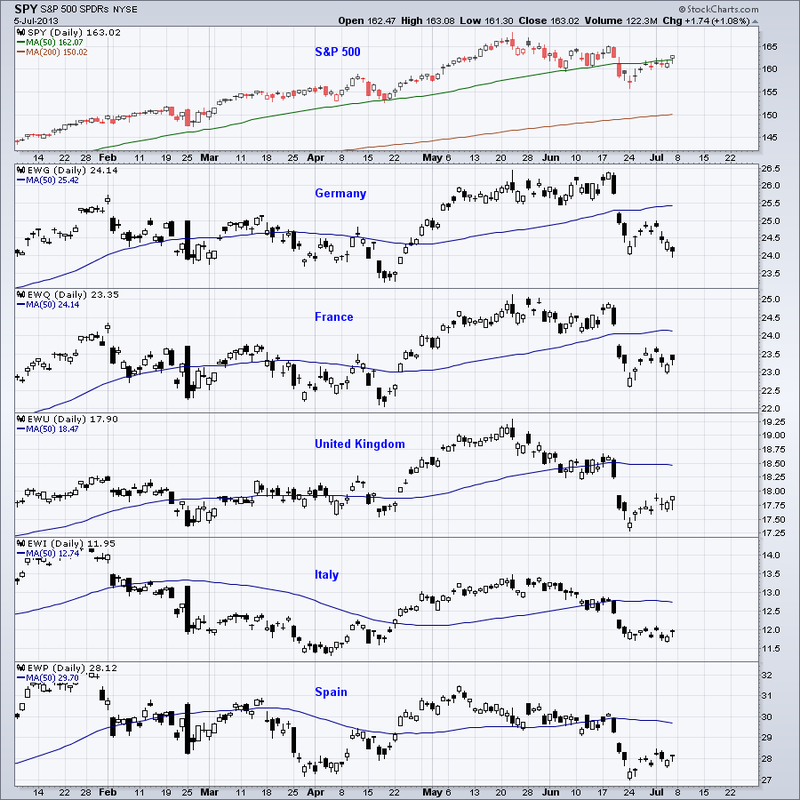
The charts below show the S&P 500 with some of the biggest European markets and their 50-day SMA. The US market holds up pretty good but it's clearly visible that some of the European markets show strong correlation with the S&P 500.
| Simple Trading Ideas |
|
|
The charts below show the S&P 500 with some of the biggest European markets and their 50-day SMA. The US market holds up pretty good but it's clearly visible that some of the European markets show strong correlation with the S&P 500.
0 Comments
The Accumulation Distribution Line is calculated from the current price and volume. It measures the cumulative flow of money into and out of the security, in this case the S&P 500 (SPY). There are three steps to calculate ADL. First, calculate the Money Flow Multiplier which tells us the relationship of the current close to the high-low range. The Money Flow Multiplier fluctuates between +1 and -1. It’s positive when the close is in the upper half of the high-low range and negative when in the lower half. Second, multiply this by the volume which gives us the Money Flow Volume. Third, calculate a running total for the Money Flow Volume. Here are the 3 steps of the calculation: 1. Money Flow Multiplier = [(Close - Low) - (High - Close)] /(High - Low) 2. Money Flow Volume = Money Flow Multiplier x Volume for the Period 3. ADL = Previous ADL + Current Period's Money Flow Volume We can use ADL to confirm the price trend or look for bullish or bearish divergences. The chart below shows that both the price chart and ADL is moving down. This reinforces the current selling pressure. The indicator window also shows the 20-day SMA for ADL. ADL is currently below its 20-day SMA which is also bearish. 
Cyclicals became the best performing sector during the past month. 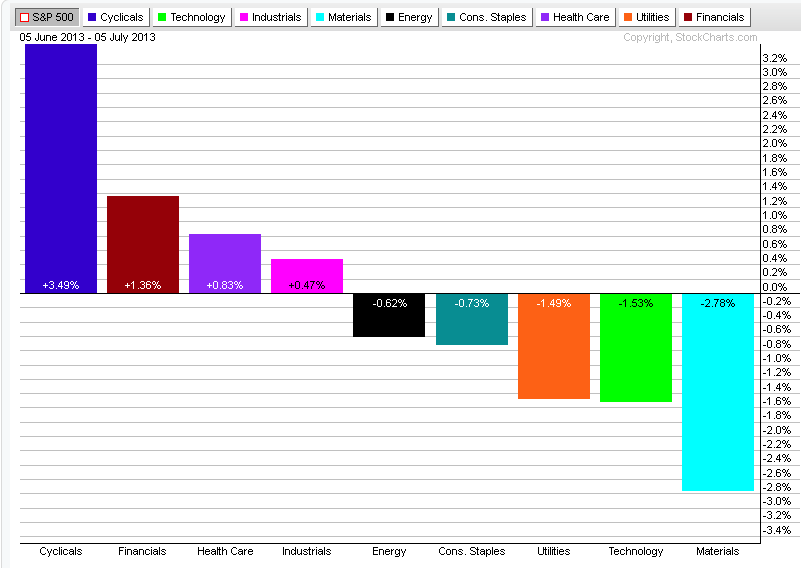 Just like regular puts, debit put spreads can be in the money (ITM), at the money (ATM) and out of the money (OTM) depending on the strike prices relative to the security’s current price. Here we are going to examine four different debit put spreads for SPY with August expiration date. SPY is currently trading at 161.28. The 167/164 and 165/162 spreads are in the money since both the long and short options have strike prices above the current price. The 163/160 spread is at the money since the long option’s strike price is above the current price and the short option’s strike price is below the current price. The 161/158 put spread is out of the money since both strike prices are below the current price. All spreads are 3 point wide. What I am interested is to find out how the strike prices affect the maximum profit, the breakeven point and the maximum loss. I also want to know the probabilities associated with the maximum profit, breakeven point and maximum loss. The table below shows the data I calculated and used and the chart summarizes the results. The table and the chart clearly shows that in the money debit spreads have much higher probability and even if the stock moves against you, you can still make money. You don’t have to be bearish to use this strategy. In the money debit spreads work well in neutral market conditions. 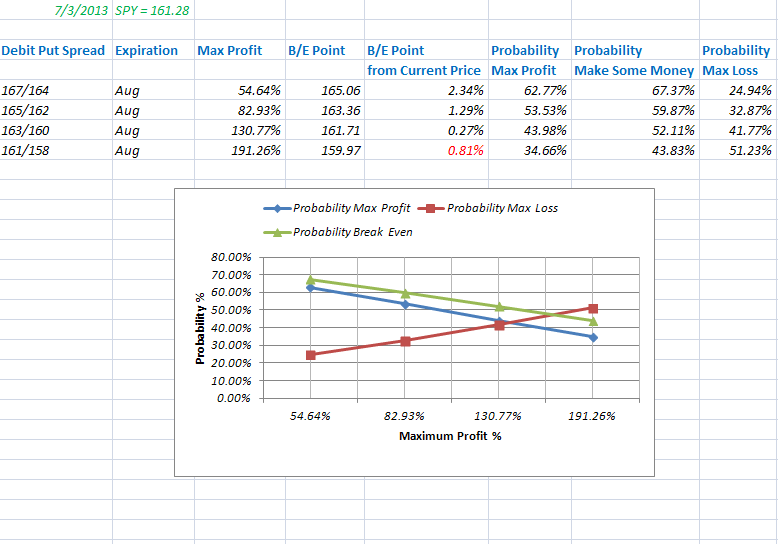
Long-term treasury bond ETF TLT is normally negatively correlated to the S&P 500. During the past couple of weeks this correlation turned positive. Soon this correlation will go back to negative. Either SPY or TLT is going to turn up. 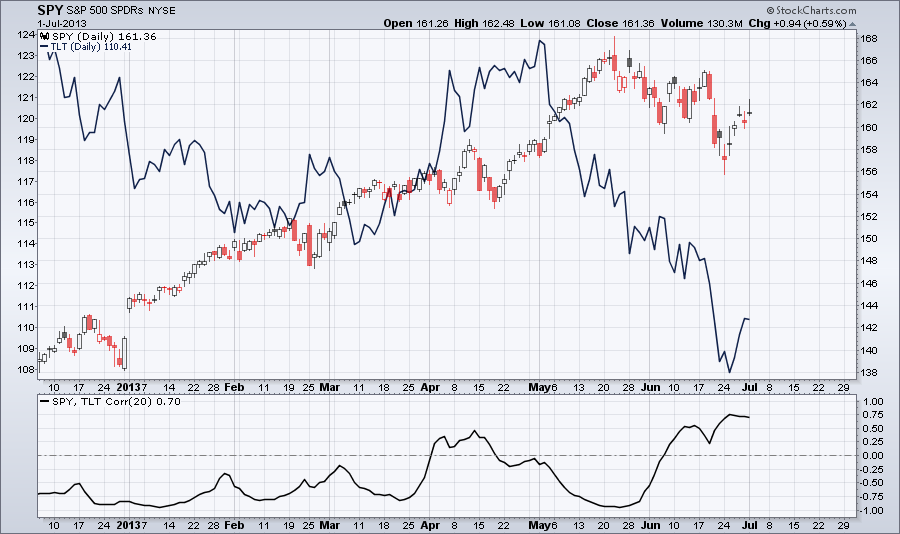 |
Loading
Search Site
Links
Archives
September 2014
Categories
All

|

 RSS Feed
