|
Realistic target could be in the 56.0-56.5 range. 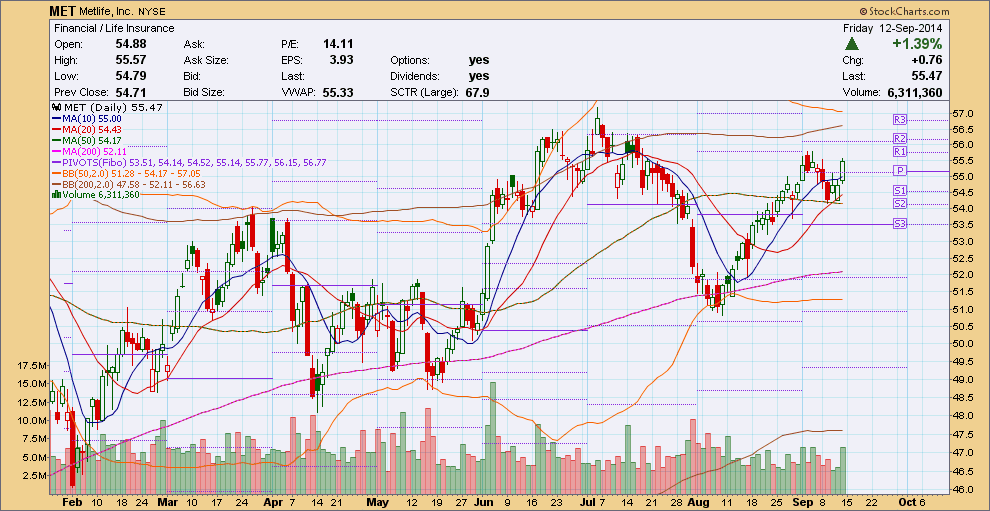
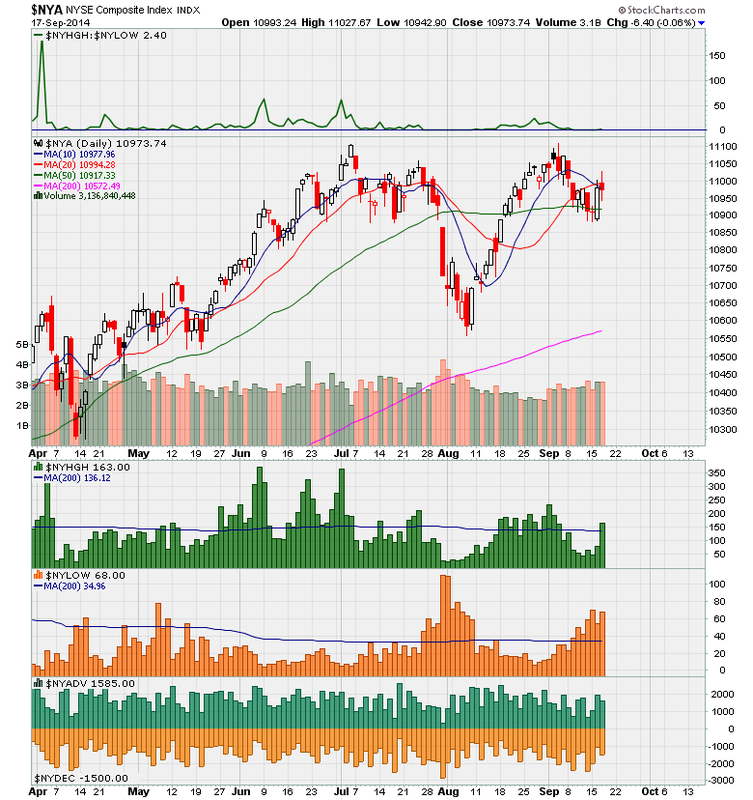
Moving averages are converging. Consolidation looks bullish on this chart. $SPX possibly moves higher next week. 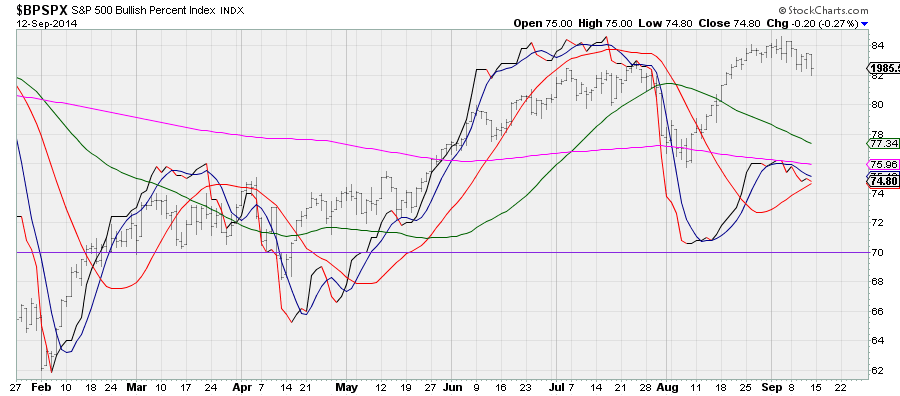
On this one I didn't look at carefully the weekly chart. I thought wave b was wave 1. Luckily there is still plenty of time. It looks like wave c is completed and is ready to turn around. I have to be more careful with weekly chart. 
Looks pretty good so far. I have to watch my target to exit in time. This 
RSI has been over 70 for over a year. Notice that the Bollinger Band is narrowing. MACD is flying high. There is no divergence yet on MACD of Slow Stochastic. 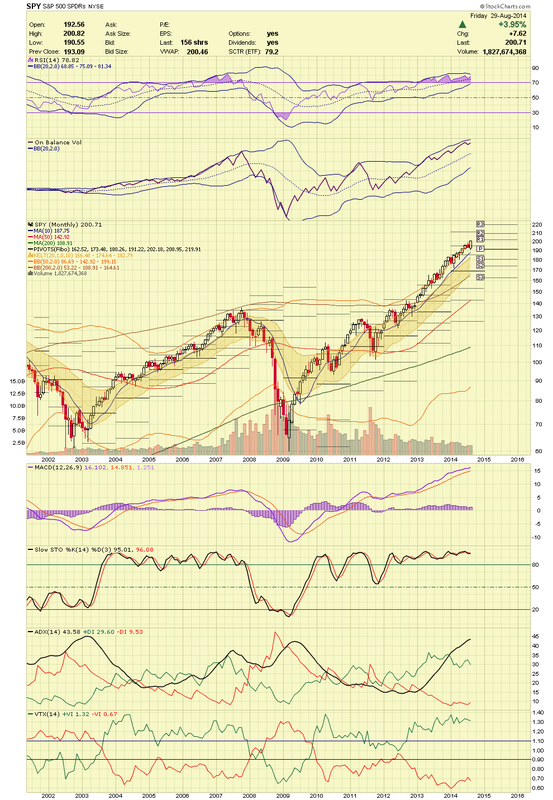
MACD is turning up. Indicators show strength. There is no parabolic movement, moving averages are nice and parallel. 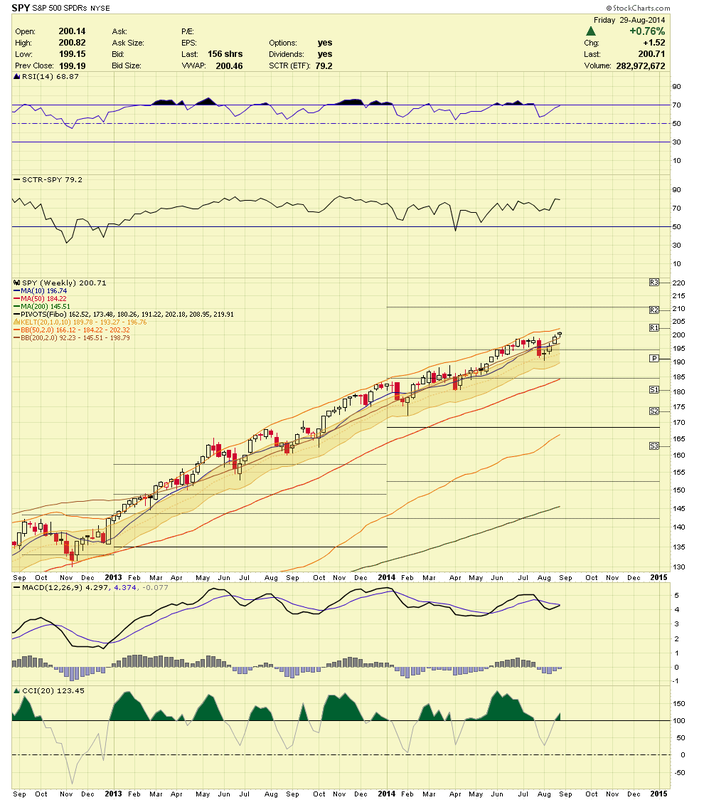
|
AuthorMy favorite pass-time is analyzing the market and analyzing individual stocks. I am investigating certain aspects of the market which demonstrates strength or weakness and thereby making the right decisions in my trades. ArchivesCategories
All
|
 RSS Feed
