The market had a nice run since mid-November. If you didn't miss it that's great, if you missed it don't worry this is not the last one. There will be other good entry points (but not very soon). Although the news is telling us that the market has reached its all time high but I don't think this is the right time to jump into long positions. Below there is a list why I think you should wait. In fact in you want to buy at the bottom of the next pullback this is the time to raise some cash.
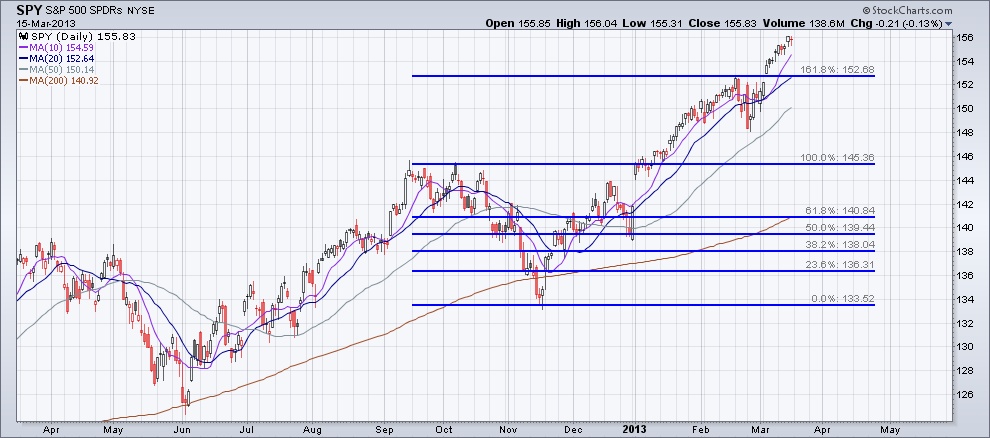
- As I mentioned the market had a nice run and as you can see on the chart below it advanced over 162 % relative to the previous pullback. It's hard to imagine that it will go much higher.
- Technical indicators are showing that all sectors are getting overbought.
- Technical indicators are showing divergences.
- Breadths indicators are showing divergences.
- Cycle analysis shows that the current cycle might end soon.
- Prices moved away quite a bit from the 200-day SMA on the daily chart for SPY (over 10 %).

 RSS Feed
