• Blog
  • Interesting Articles
  • The Smart Option Trader
  • Charting
  • Contact
  • About
  • Disclosure
Simple Trading Ideas
"A trading plan is just words until you act on it."

Where Do Cycles Peak

3/9/2013

0 Comments

 
As cycles are part of nature they are also part of financial markets. As prices change highs and lows repeat itself on a regular basis. Price and time cycles can help us to anticipate turning points. Normally lows are used to define cycle length and then project future cycle lows. The lenght of cycles can change over time. Cycle analysis works best if combined with other apects of technical analysis. One of the cycle characteristics is translation. Translation describes where is the peak during a cycle. Most of the time peaks occur before or after the midpoint of the cycle. Right translation occurs when the peak is after the midpoint of the cycle. Usually in a storing bull market cycles have right translation. Left translation occurs during bear markets when the cycle peaks earlier during the cycle. At market tops and bottoms peaks are closer to the midpoint. The chart below shows a possible outcome of the current market using cycle analysisfor SPY.

Picture
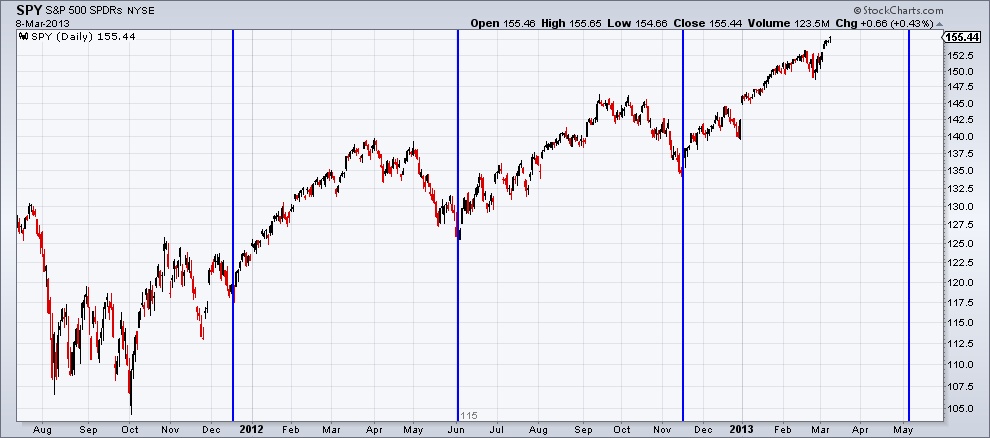
As you can see so far the cycles of SPY have right translation wich is bullish.
0 Comments


Leave a Reply.

    Loading

    Search Site

    Links

    SmartTradingIdeas
    Save $150 off all Surface Pro 3 devices! Eligible for university-level students who are enrolled in an academic institution and are able to verify with a .edu email address. Valid 8.3 – 9.3.14.
    Microsoft Store
    Download, compare & review popular software directly from Microsoft.

    Archives

    September 2014
    August 2014
    July 2014
    June 2014
    May 2014
    April 2014
    March 2014
    February 2014
    January 2014
    December 2013
    November 2013
    October 2013
    September 2013
    August 2013
    July 2013
    June 2013
    May 2013
    April 2013
    March 2013

    Categories

    All
    Advance-decline
    Alternative Assets
    Asian Markets
    Bear Market
    Bollinger Bands
    Bonds
    Breadth Indicator
    Breadth Indicator
    Bull Market
    Candlesticks
    Chart Patterns
    Correction
    Correlation
    Cycle Analysis
    Cycles
    Divergence
    Diversification
    Eem
    Efa
    Elliott Waves
    Emerging Growth Stocks
    European Markets
    Fibonacci
    Financial News
    Futures
    Gold
    Insider Trading
    Keltner Channels
    Large Caps
    Market Carpet
    Market Correction
    Market Outlook
    Market Outlook
    Mid Caps
    Momentum Indicator
    Moving Average Ribbon
    Options
    Option Strategy
    Penny Stocks
    Pivot Points
    Put/Call Ratio
    Risk/Return
    Sector Performance
    Sector Rotation
    Sectors
    Sentiment Indicator
    Small Caps
    Spy
    Stocks
    Technical Analysis
    Technical Indicators
    Trading Advice
    Trading Ideas
    Us Dollar
    Virtual Trading
    Vix
    Volatility
    Volatility Chart
    Volatility Skew
    Yield Curve

    Picture

    RSS Feed


Powered by Create your own unique website with customizable templates.