Securities don't trend all the time. If they would, investing in securities would be the easiest thing to do. In an uptrend when prices move up it gains momentum, more and more buyers participate. Buyers become optimistic and demand exceeds supply driving prices even further up.
When this happens, prices move away from they longer term averages. This can be seen on a chart adding moving averages. The moving averages sort of fan out and they don't run parallel anymore. How long can it be sustained?
At some point momentum start to fade. Some of the buyers are not willing to pay higher prices or don't buy at all being afraid that prices will reach their limit soon. At this point not only momentum indicators but other indicators show that the trend might be exhausted. This could happen in any time frame.
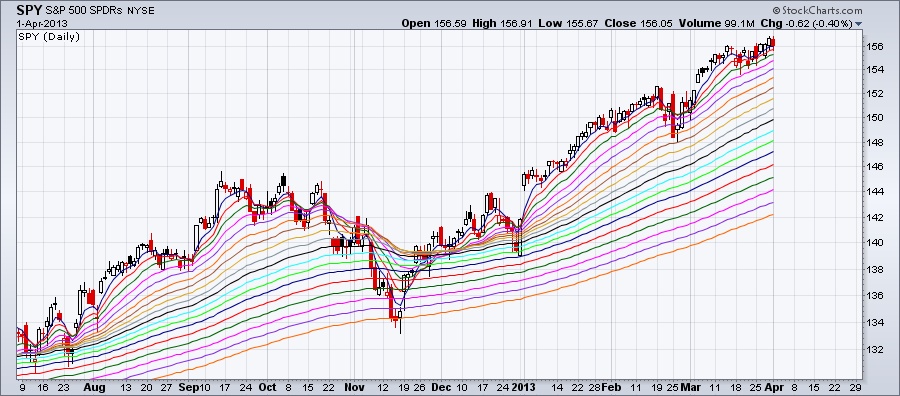
This is the end of an uptrend followed by a consolidation or correction when prices revert back to their mean value. When this happens, the moving averages are getting closer again. The shorter moving averages even cross below the longer moving averages. In a healthy uptrend this mean reversion doesn't last long proportionally to the cycle.
The moving average ribbon chart below shows how the moving averages "behave" in an uptrend and during a correction when mean reversion takes place.
When this happens, prices move away from they longer term averages. This can be seen on a chart adding moving averages. The moving averages sort of fan out and they don't run parallel anymore. How long can it be sustained?
At some point momentum start to fade. Some of the buyers are not willing to pay higher prices or don't buy at all being afraid that prices will reach their limit soon. At this point not only momentum indicators but other indicators show that the trend might be exhausted. This could happen in any time frame.
This is the end of an uptrend followed by a consolidation or correction when prices revert back to their mean value. When this happens, the moving averages are getting closer again. The shorter moving averages even cross below the longer moving averages. In a healthy uptrend this mean reversion doesn't last long proportionally to the cycle.
The moving average ribbon chart below shows how the moving averages "behave" in an uptrend and during a correction when mean reversion takes place.

 RSS Feed
