It’s nice to ride a trend for as long as you can without getting stopped out too often. Let’s look at the uptrend the US markets had which started last year in Mid-November. Were you able to stay in this uptrend from the beginning to the end?
When you trade you always want to set your stop-loss to limit your losses. Never trade without setting stop-losses. As the market moves up in an uptrend you want to adjust your stop-loss to increase your profit, this is also called trailing stop-loss. The trailing stop-loss stays below the price in an uptrend and above the price in a downtrend. Setting the stop-loss too close to the price, results in being stopped out too early and too frequently.
Volatility changes during an uptrend (or a downtrend) and from time to time prices can be quite volatile. Usually that’s when you get stopped out. So it makes sense to use a trailing stop-loss which gives a volatility-based buffer. This means that when volatility increases the distance between the price and the stop-loss increases.
That’s exactly what the Chandelier Exit does. The Chandelier Exit is usually calculated for 22 trading days which is a month. The calculation is as follows for an uptrend:
Chandelier Exit (long) = 22-day High - ATR(22) x 3
and
Chandelier Exit (short) = 22-day Low + ATR(22) x 3
for a downtrend.
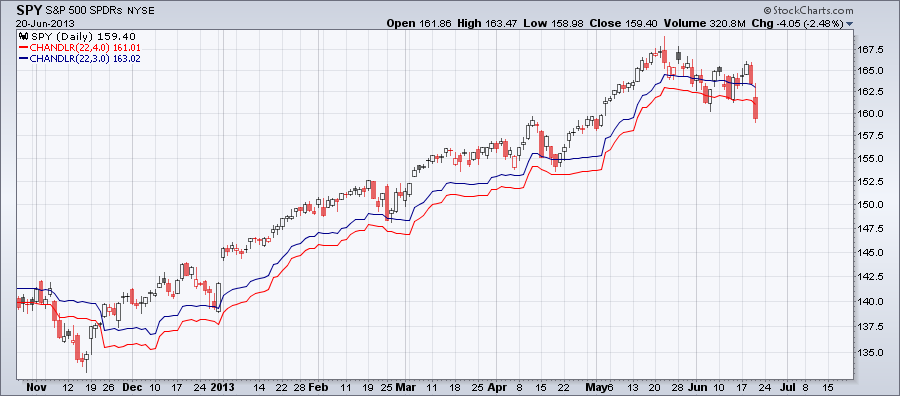
ATR the Average True Range is used to calculate volatility. In the expressions above 3 is used as a multiplier but it can be changed. For more volatile securities you want to increase it and since downtrends are more volatiles you want to increase there too. The chart below shows SPY with too Chandelier lines, the blue is calculated with 3 and the red with 4 as a multiplier. As you can see 4 as a multiplier would have kept you in the trade longer since there were times when SPY was quite volatile.
When you trade you always want to set your stop-loss to limit your losses. Never trade without setting stop-losses. As the market moves up in an uptrend you want to adjust your stop-loss to increase your profit, this is also called trailing stop-loss. The trailing stop-loss stays below the price in an uptrend and above the price in a downtrend. Setting the stop-loss too close to the price, results in being stopped out too early and too frequently.
Volatility changes during an uptrend (or a downtrend) and from time to time prices can be quite volatile. Usually that’s when you get stopped out. So it makes sense to use a trailing stop-loss which gives a volatility-based buffer. This means that when volatility increases the distance between the price and the stop-loss increases.
That’s exactly what the Chandelier Exit does. The Chandelier Exit is usually calculated for 22 trading days which is a month. The calculation is as follows for an uptrend:
Chandelier Exit (long) = 22-day High - ATR(22) x 3
and
Chandelier Exit (short) = 22-day Low + ATR(22) x 3
for a downtrend.
ATR the Average True Range is used to calculate volatility. In the expressions above 3 is used as a multiplier but it can be changed. For more volatile securities you want to increase it and since downtrends are more volatiles you want to increase there too. The chart below shows SPY with too Chandelier lines, the blue is calculated with 3 and the red with 4 as a multiplier. As you can see 4 as a multiplier would have kept you in the trade longer since there were times when SPY was quite volatile.

 RSS Feed
