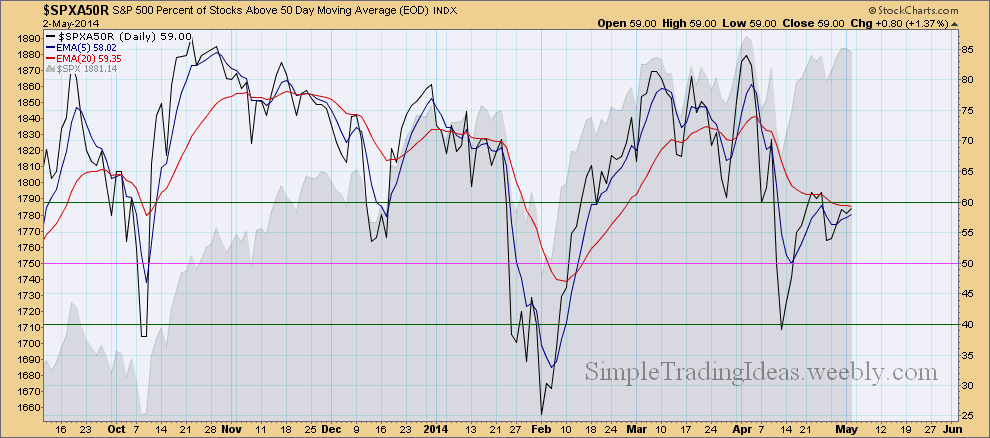
There are three daily charts below of three different breadth indicators. These three indicators don’t seem to support a possible upside breakout in the near future. First let’s start with $SPXA50R. This breadth indicator tells us the percentage of S&P 500 stocks Above their 50-day Moving Average. You can read more about this breadth indicator here. This indicator has been moving lower creating a bearish divergence. Over 40% of the stocks in the S&P 500 are below their 50-day moving average. See the chart below.
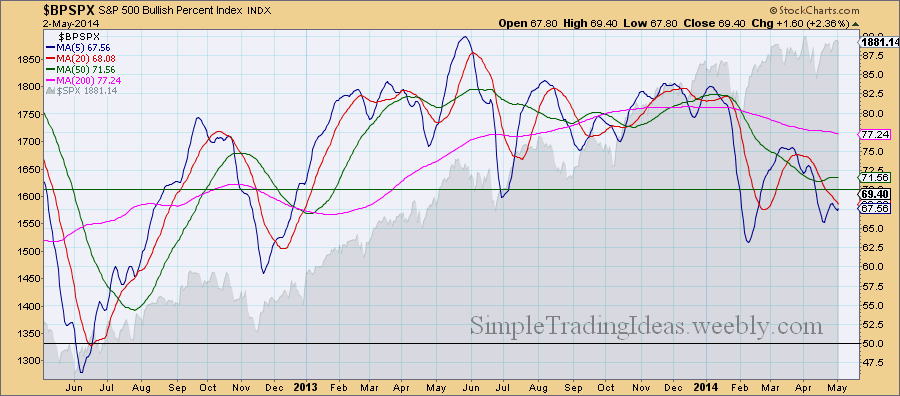
This next chart shows $BPSPX, the S&P 500 Bullish Percent Index. $BPSPX is a breadth indicator showing the percentage of S&P 500 stocks with Point and Figure buy signals. A Point and Figure chart either gives buy signal or sell signal. Read more about $BPSPX here. Over 30% of the S&P 500 stocks are on a P&F sell signal. See the Chart below.
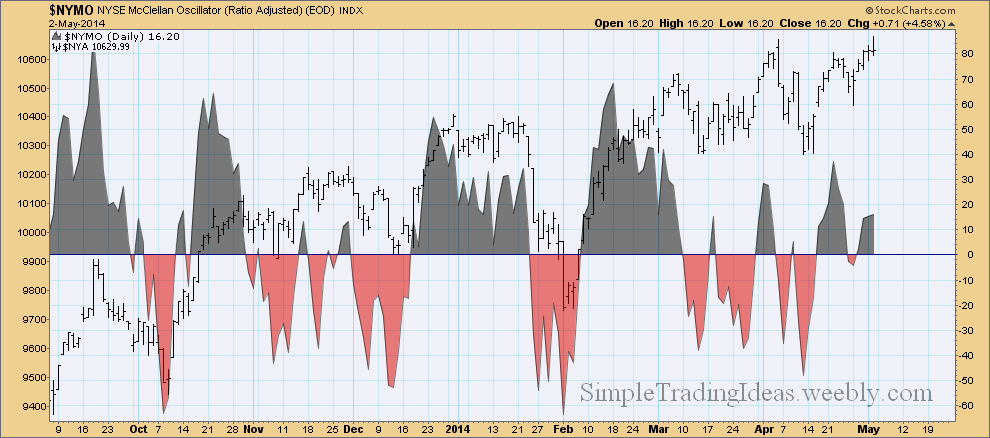
The third chart shows the NYSE McClellan Oscillator, $NYMO. This breadth indicator is calculated from the Net Advances on the New York Stock Exchange. Net Advances are the number of Advancing Issues less the number of Declining Issues. You can read more about $NYMO here. $NYMO has been pretty flat since March, not showing much enthusiasm among buyers or sellers.

 RSS Feed
