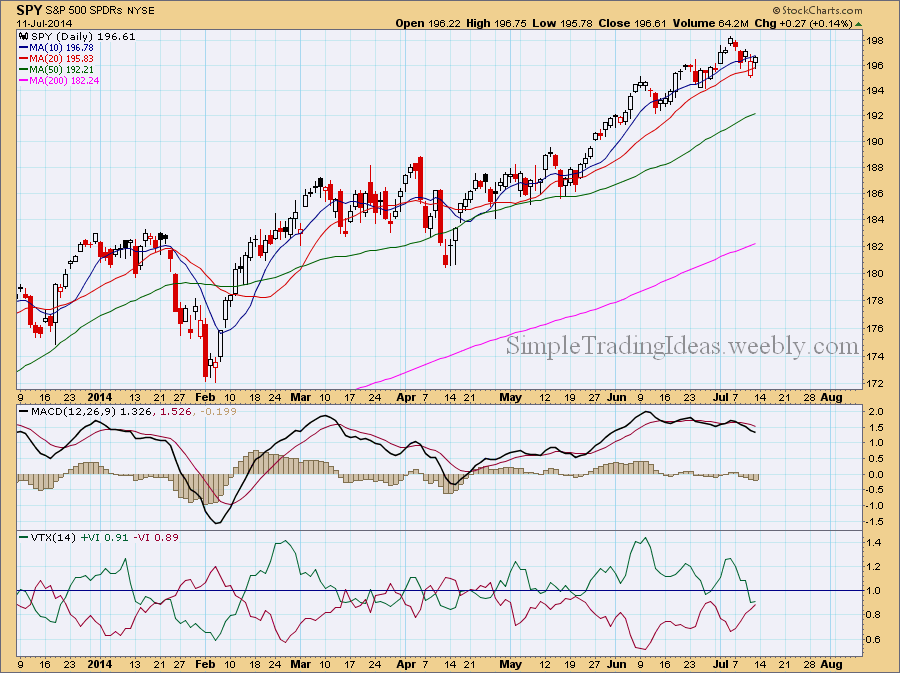
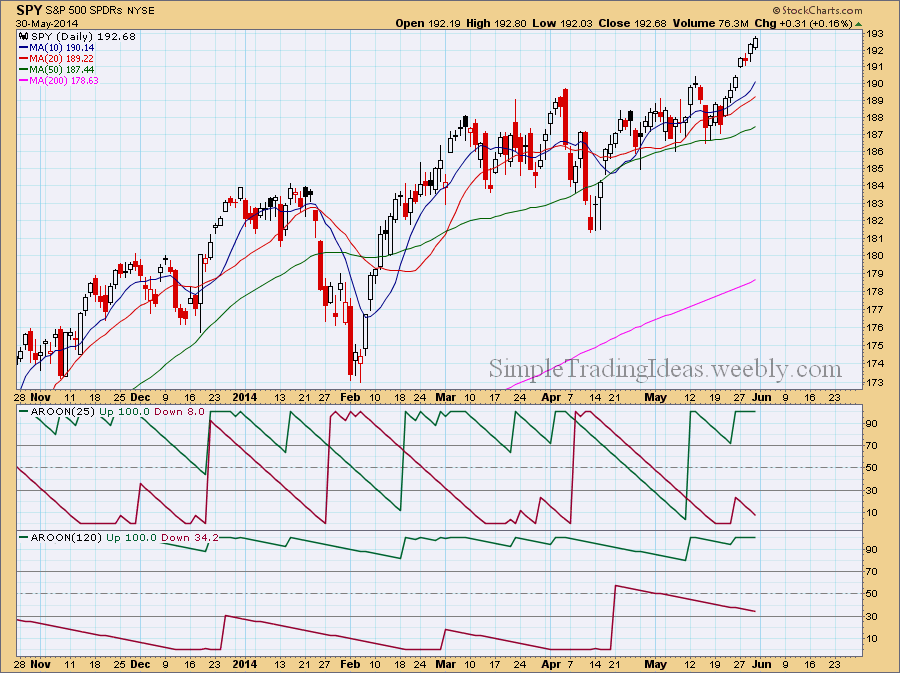
The daily chart below shows SPY, the S&P 500 SPDR ETF with two indicators below the chart. Both indicators show signs of weakness. MACD is below its signal line and the Vortex indicator shows that both the positive and negative trend indicators are below 1.0 and they are almost equal.
0 Comments
The daily chart below shows CPC, the CBOE Options Total Put/Call Ratio. CPC is increasing when investors start to get more bearish and want to protect their portfolio by buying more put options. The Total Put/Call Ratio has been sharply increasing in the past two weeks. Normally the correlation between the Total Put/Call Ratio and the S&P 500 is negative but notice how recently this correlation turned positive meaning they are both moving in the same direction, higher. You can see the correlation coefficient in the indicator window below the chart.
The performance chart below shows that the Cyclicals sector and the Utilities sector performed the best with the Technology sector and the Health Care sector not far behind during the past week
Duke Energy Corporation is a large-cap company with around 50 billion market cap. It has a low beta value and the correlation to the S&P 500 is not even close (as you can see in the indicator window below the daily chart), but this stock is not boring. Duke is moving in an uptrend, you can check it out on the weekly chart and it makes around 9-10% impulsive waves and around 6-7% corrective waves as it slowly advances higher. This company has good fundamentals too. All these make Duke a good candidate for swing trading. The daily chart below shows a recent trade setup using Elliott Waves with Fibonacci Levels. The stock completed a corrective wave right before the middle of June marked with i-ii-iii. The 200-day moving average provided support. Wave iii is shorter than wave i and this makes this setup even more bullish. The stock quickly started to move higher in wave 1 when the smart money started to buy. The green volume bar nicely broke above the average trading volume. Wave 2 followed wave 1 with a 50% retracement. This can be seen better on the Hourly chart, not shown here. On June 18, yesterday, the price broke thru the blue line which is the upper channel of the corrective downtrend and the stock advanced 2.40%. This is when the retail traders started to pile in. The volume bar confirms that too. The stock nicely advanced today too. So currently we are in wave 3. wave 3 has the potential to extend twice as long as wave 1 or even more. Using Fibonacci levels and the upper channel (green line) I am estimating how far this move can extend. If I want to be more conservative I set the target to the 123.6-138.2% level or the 150% level. Of course there will be some red candles on the way up to the target and also a wave 4 which will probably be shallow.
The daily chart below shows SPY, the SPDR S&P 500 ETF representing the Large-Caps. SPY was overbought recently as you can see in the indicator window above the chart and it's not a surprise if SPY moves lower or sideways in the short-term. MACD also looks like ready to cross below the signal line. For the next support level we can use Fibonacci retracement levels, most likely the 50-62% levels and the 187.60 level (red line). SPY crossed this level several times during the past couple of months.
The market carpet below shows 265 stocks in the S&P 500 where the 25-period Weekly Aroon Up trend indicator is larger than 70. The market carpet shows how these stocks performed during the past week.
The chart below shows how the 9 sectors performed relative to the S&P 500 during the past week. The Offensive sectors clearly outperformed the S&P 500 and the defensive sectors were lagging.
Tha daily chart below shows SPY, the S&P 500 ETF with the daily and weekly Aroon trend indicators in the indicator window. The shorter period Aroon represents the daily trend and the longer period the weekly trend. Currently Aroon Up is 100 for both of them.
You should treat trading as a serious business. When you prepare yourself and when you trade you should be able to pay full attention. Anything which distracts you can affect your trades and your profit. Here is a list of what can turn against you in trading:
· Unorganized environment – You desk and computer should be well organized. Material and all the “noise” not related to trading should be eliminated. Don’t try to multitask. · Physically not prepared – Even if you are not a day trader when you prepare yourself for a trade you should be able to focus for a longer period of time. If you are hungry, tired or sick you won’t able to do that. · Mentally not prepared – You should have a clear and proved trading plan and stick to it. You can’t change it in the middle of trades. You should feel confident and comfortable with the knowledge you accumulated about trading. · Emotionally not prepared – If you have strong emotions such as anger, sadness, and disappointment about trading then you are not prepared. The stock market doesn’t care about your feelings. · Unable to execute a trading plan – If you can’t follow your trading plan and you hesitate when you enter or exit a position then you are not prepared. · Not being patient – Patience is very critical. A stock could be a great candidate for trading but you have to wait out the right moment. Jumping into trades too early can end up in painful losses. · Unable to filter out the news – You have to learn what news is important and what is just noise. The bulls and bears have always something to say and both of them can’t be right. · Telling everybody about your trades – When you talk to your friends and sometimes strangers about your trades it’s hard to explain when you are wrong. The best thing to do is to keep it private. The performance chart below shows the Railroad, Trucking and Delivery Services indices during the past three months. These three indices are components of the Industrial Sector. All three of them are in an uptrend. This shows a healthy economy where there is a need to transport all the unfinished and finished goods between suppliers and customers.
|
Loading
Search Site
Links
Archives
September 2014
Categories
All
|