• Blog
  • Interesting Articles
  • The Smart Option Trader
  • Charting
  • Contact
  • About
  • Disclosure
Simple Trading Ideas
"A trading plan is just words until you act on it."

How Many Indicators Should I Use

3/9/2013

0 Comments

 
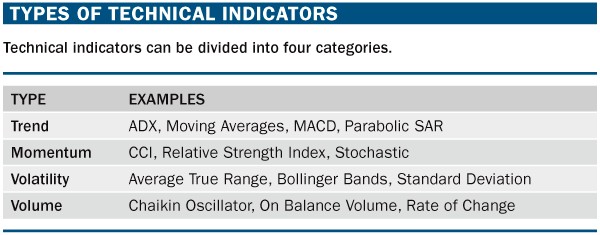
Technical indicators are trading tools which can be very uselful if they are used properly. Indicators use various mathematical calculations to visualize certain characteristics of past and current price movements and volume changes. There is a large number of indicators which makes it very difficult to decide which ones to use.  Novice chartists often put too many indicators on their charts with often redundant information. This also makes it difficult to make a quick decision. Indicators can be grouped in for different groups:

  • Trend indicators - they meaure the direction and strenght of the trend
  • Momentum indicators - they tell us about the speed at which prices change
  • Volume indicators - they are based on calculations which tells how much volume changes with price       movements
  • Volatility indicators - helps to determine the volatility, the higher the volatility the riskier the security
This groups measure different characteristics of the security. It's important to use indicators from different indicator groups when you develope your trading strategy. Several indicators from the same group would only give redundant information and is also called multicollinearity. If two different indicators give very similar signals you know that they belong to the same indicator group. The table below helps to select indicators from different groups:
Picture
0 Comments


Leave a Reply.

    Loading

    Search Site

    Links

    SmartTradingIdeas
    Save $150 off all Surface Pro 3 devices! Eligible for university-level students who are enrolled in an academic institution and are able to verify with a .edu email address. Valid 8.3 – 9.3.14.
    Microsoft Store
    Download, compare & review popular software directly from Microsoft.

    Archives

    September 2014
    August 2014
    July 2014
    June 2014
    May 2014
    April 2014
    March 2014
    February 2014
    January 2014
    December 2013
    November 2013
    October 2013
    September 2013
    August 2013
    July 2013
    June 2013
    May 2013
    April 2013
    March 2013

    Categories

    All
    Advance-decline
    Alternative Assets
    Asian Markets
    Bear Market
    Bollinger Bands
    Bonds
    Breadth Indicator
    Breadth Indicator
    Bull Market
    Candlesticks
    Chart Patterns
    Correction
    Correlation
    Cycle Analysis
    Cycles
    Divergence
    Diversification
    Eem
    Efa
    Elliott Waves
    Emerging Growth Stocks
    European Markets
    Fibonacci
    Financial News
    Futures
    Gold
    Insider Trading
    Keltner Channels
    Large Caps
    Market Carpet
    Market Correction
    Market Outlook
    Market Outlook
    Mid Caps
    Momentum Indicator
    Moving Average Ribbon
    Options
    Option Strategy
    Penny Stocks
    Pivot Points
    Put/Call Ratio
    Risk/Return
    Sector Performance
    Sector Rotation
    Sectors
    Sentiment Indicator
    Small Caps
    Spy
    Stocks
    Technical Analysis
    Technical Indicators
    Trading Advice
    Trading Ideas
    Us Dollar
    Virtual Trading
    Vix
    Volatility
    Volatility Chart
    Volatility Skew
    Yield Curve

    Picture

    RSS Feed


Powered by Create your own unique website with customizable templates.