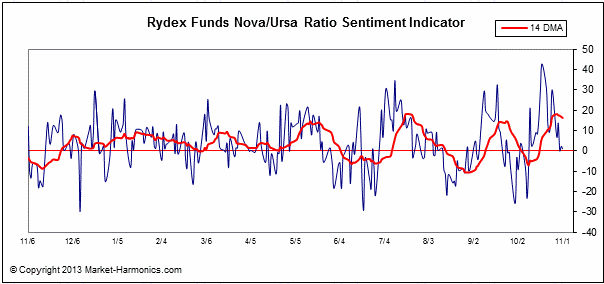
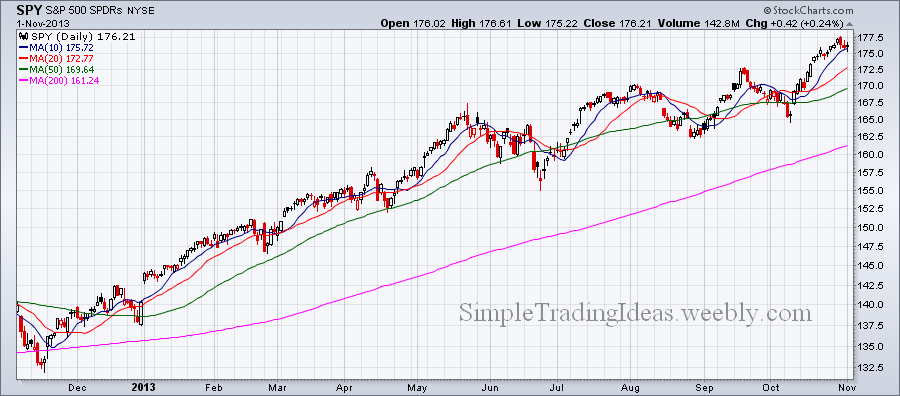
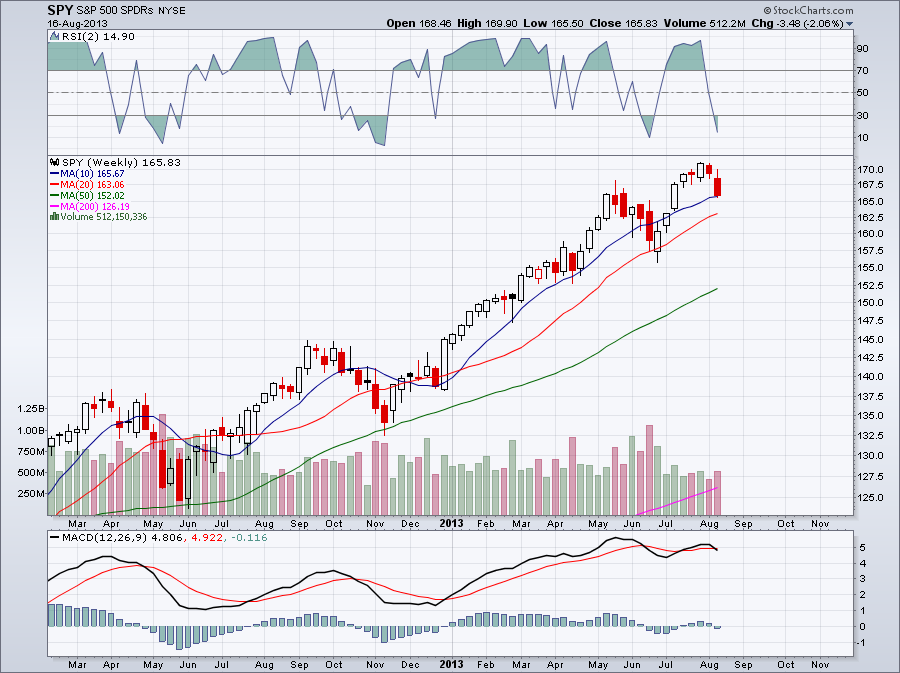
This ratio is a sentiment indicator. The two funds are tide to the daily performance of the S&P 500. The Nova Fund gains value if the S&P 500 gains value And the Ursa Fund gains value when the S&P 500 declines. SPY is shown below the Nova/Ursa ration chart. The close correlation is clearly visible.
0 Comments
The daily chart below shows SPY with two 50-period Bollinger Bands, one with 1 standard deviation and the other one with 2 standard deviation. SPY has been able to stay above the lower 1 standard deviation Bollinger Band and it has been strong enough to touch or move above the 2 standard deviation upper Bollinger Band during the time frame shown on the chart. In the past SPY moved lower after such an explosive move above the upper Bollinger Band.
Less than 40 percent of the S&P 500 stocks are above their 50-day moving average. Even the 5-day EMA is below 40. The chart below shows the 5-day and 20-day EMA for $SPXA50R with $SPX in the background.
I put in a couple of trades recently and I'll show them in my virtual trading account. One of them is a VIX call option with September expiration. It didn't make as much money I thought it would but it still has some potentials. I also bought a GLD straddle. I am not too happy with that, I'll sell it. I expected a bigger move, but it still made some money. The best one is a SPY put with October expiration. I will definitely keep this one for a little longer.
The chart below shows the Fibonacci retracement levels relative to the move since late June. TRIX momentum oscilator and Aroon trend indicator below the chart shows bearish bias.
The weekly chart below shows SPY with the 2 period RSI and MACD. Notice that this is the second time this year when RSI(2) is below 30. MACD is below its signal line which is also sign of weakness.
The chart below shows SPY with the 20-day, 50-day and 200-day Bollinger Bands. Up until mid-May SPY was walking on the upper Bollinger Bands. Notice how momentum is fading since then and SPY is unable to move up to the 50-day and 200-day upper Bollinger Bands.
The chart below shows the weekly chart for SPY with StochRSI(14) below the chart. The 14-week StochRSI is only barely above 0.5. I'd like to see it above 0.8, that would show some strength. |
Loading
Search Site
Links
Archives
September 2014
Categories
All
|