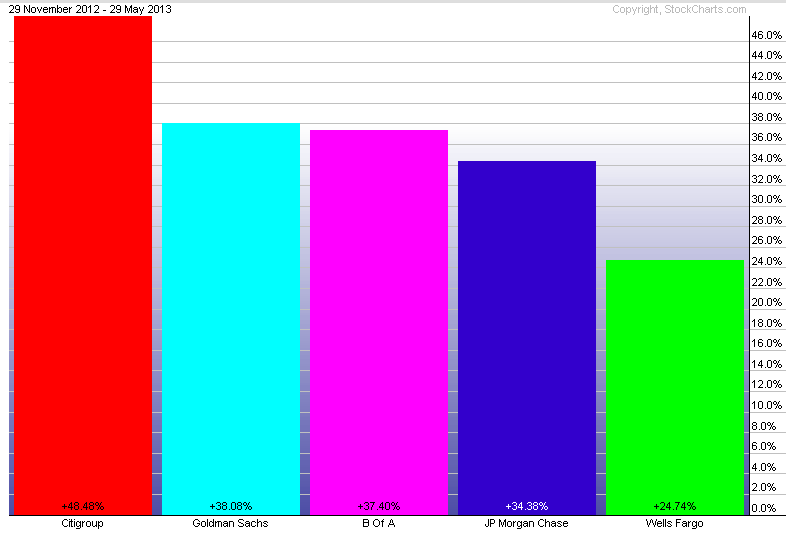
Ok, from the previous post we know that the financial sector is doing pretty good in the past six month. The performance chart below shows that big banks from the financial sector are doing even better.
| Simple Trading Ideas |
|
|
Ok, from the previous post we know that the financial sector is doing pretty good in the past six month. The performance chart below shows that big banks from the financial sector are doing even better.
0 Comments
Ther performance chart below shows the performance of 9 sectors of the s&P 500. Best performing sectors are financials and health care, worst performing sectors are utilities and technology. 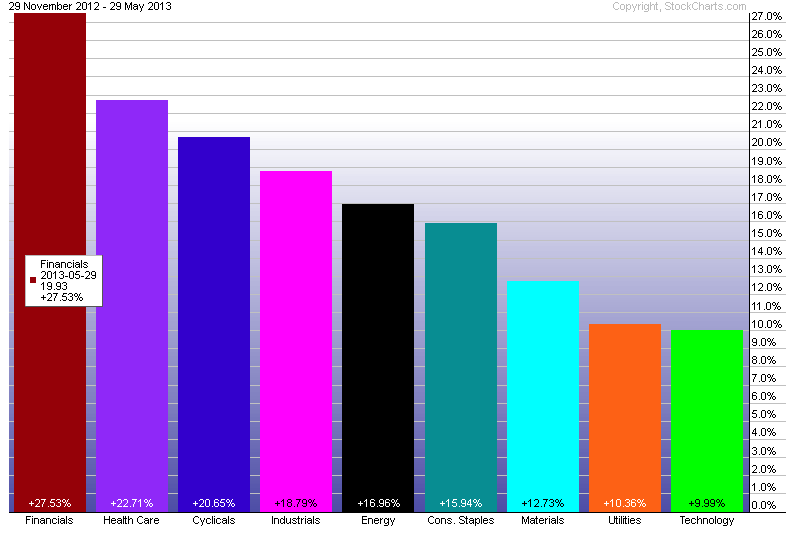
The chart below shows the daily chart for the utilities ETF, XLU. XLU started correction earlier in May. Notice the increased selling pressure the past couple of trading days. The Aroon indicator shows that the ETF is trending down. The utilities sector is the worst performing sector in the past month. 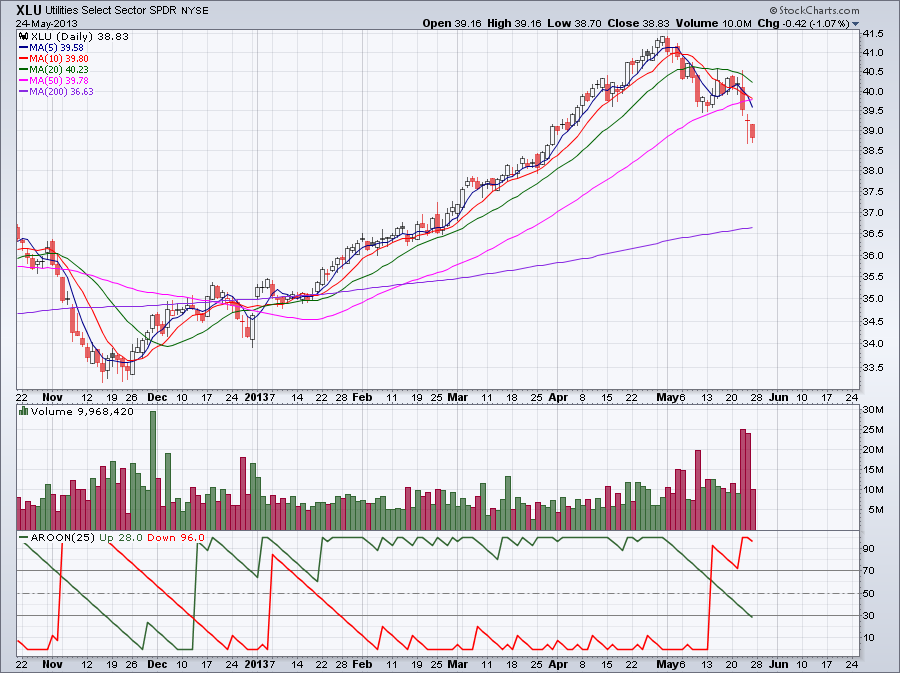 The pharmaceuticals sector was one of the best performing sector during the past week 
All major US airlines are looking great in the past three months. 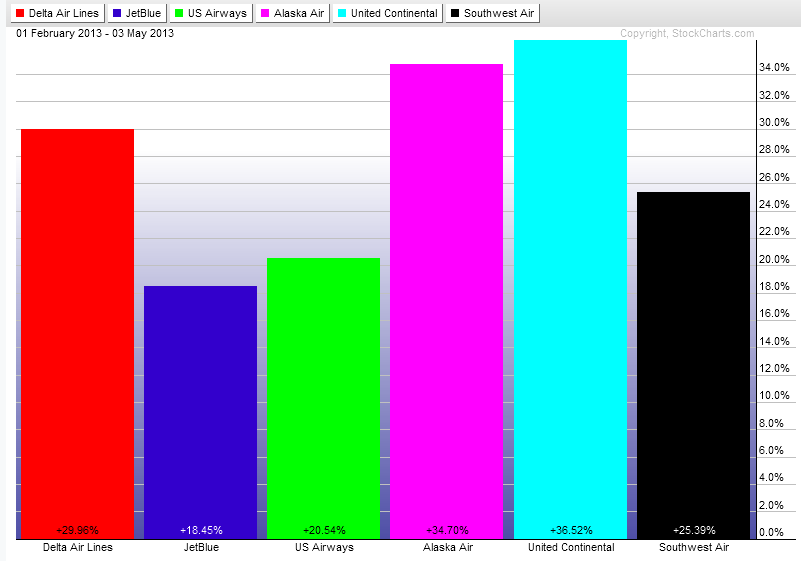
I guess I'm not alone, the brewers are doing good in the past 90 days.  The market carpet below shows the performance of the 9 sectors in the past 15 days. As you can see the defensive sectors are the winners and the energy, materials and the industrials sectors are the losers. 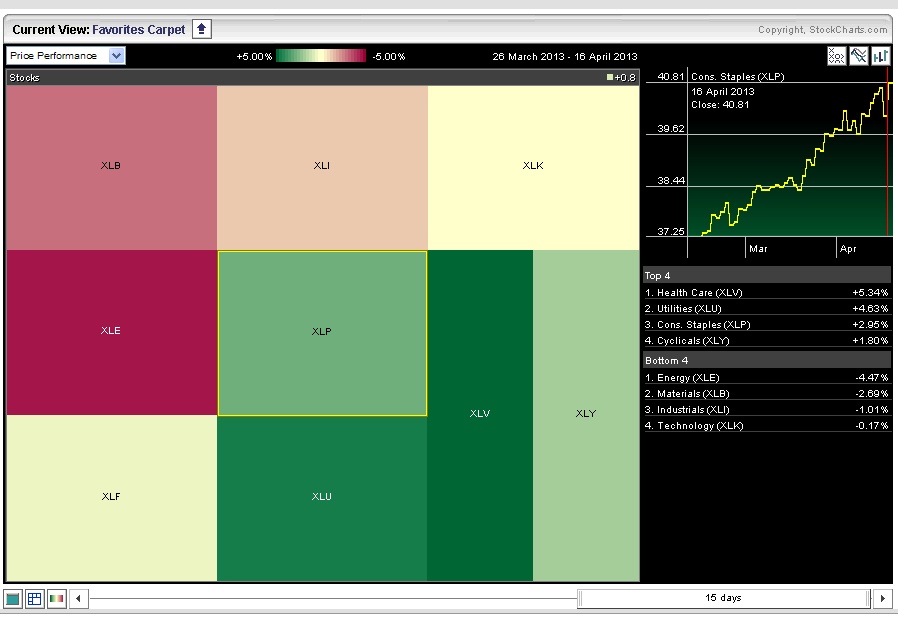
|
Loading
Search Site
Links
Archives
September 2014
Categories
All

|
 RSS Feed
