|
The chart below shows that the number of stocks reaching 52-week new highs for the New York Stock Exchange has been dramatically increasing this year. 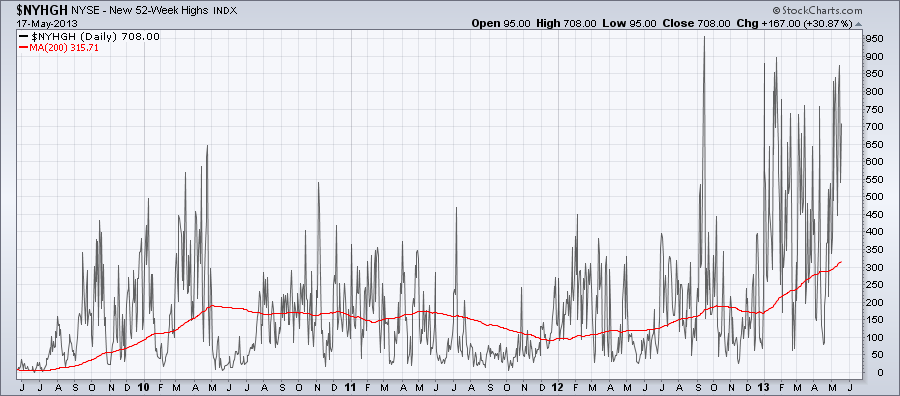
The yield curve plots the interest rates of bonds with different maturity dates at a specific time. Usually the yield curve compares the three-month, two-year, five-year, seven-year, 10-year, 20-year and 30-year Treasury debt. Studying the yield curve helps us to better understand the economic cycle and predict changes in the economic growth. At different stages of the economic cycle the yield curve also changes shape. There are three main types of yield curves, normal, flat and inverted. The yield curve is normal when the interest rate of bonds with shorter maturity date is less then with longer maturity dates. Normal yield curve is associated with strong and healthy economy. After an extended period of time the spread between interest rates of bonds with shorter term maturity date and longer term maturity date decreases. At some point the yield curve flattens out and even gets inverted where the interest rate of bonds with longer maturity date is less than for bonds with shorter maturity date. This scenario happens months or years before the economic cycle reaches a peak and turns into recession. The chart below shows the yield curve at different times (see red vertical lines on the chart below). On this chart you can see how the yield curve changed shape. Currently the yield curve is normal which is very healthy for the stock market. It is not as steep as it was in 2009 (see the chart below). 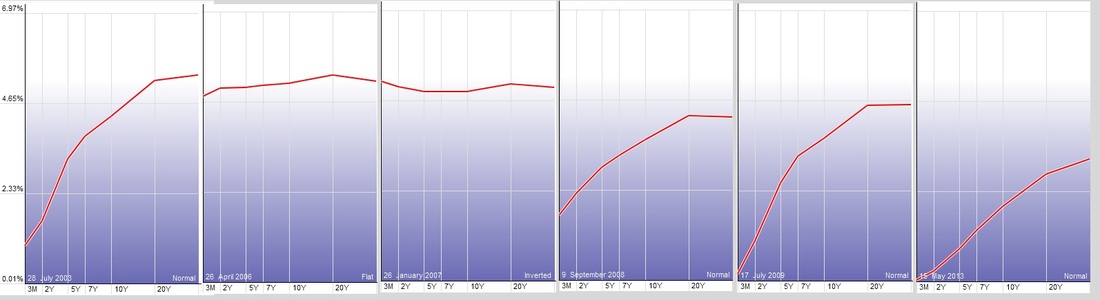

Even though SPY is moving higher $VIX also has higher lows. Investors seem to be cautious. 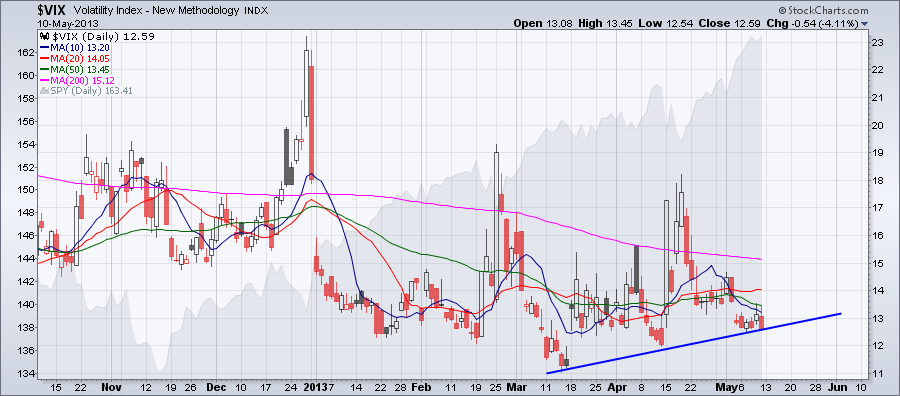 $SPXA200R - Percent of S&P 500 Stocks Above Their 200 Day Moving Average Reaches New Highs5/11/2013 As you can see on the chart below $SPXA200R is over 90%. How long can it stay in this range? 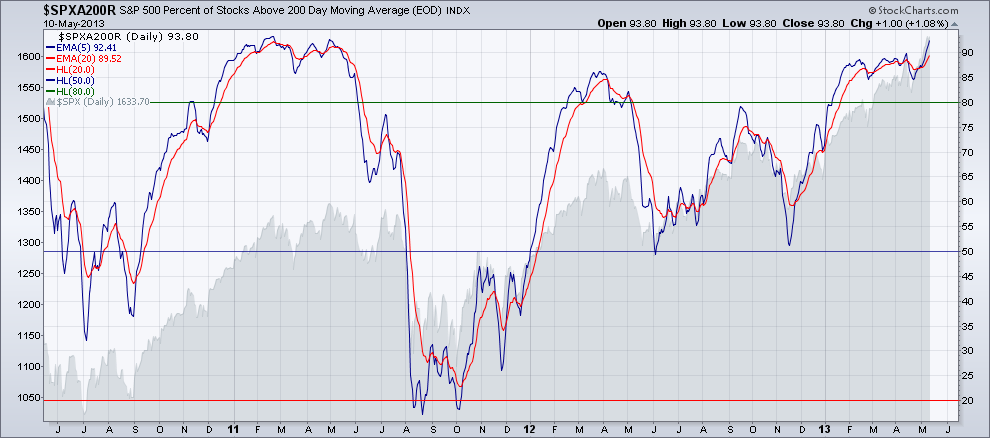
 According to the SEC (Securities & Exchange Commission) any stock trading under $5 is a penny stock. Others consider stocks trading on the Pink Sheets and the Over The Counter Bulletin Boards (OTCBB) to be penny stocks. Micro-cap (market capitalization between 50 and 300 million) and nano-cap (market capitalization under 50 million) stocks can be also considered penny stocks.
Trading penny stocks is different than trading blue chip stocks. Just like with any other securities before you trade penny stocks you should learn about the risk they involve. Trading penny stocks has advantages and some disadvantages compared to blue chip stocks. First let’s look at the disadvantages: · Penny stocks considered riskier than stocks traded on the big exchanges. One reason is that to be listed on the Pink Sheets and the OTCBB requires less requirements. These companies are only obligated to disclose limited information. Some of these companies might be under bankruptcy. · Penny stocks are more volatile. · Liquidity can be a problem with penny stocks with low volume. · You can be a victim of a pump and dump scheme if you don’t recognize it. Penny stocks have some advantages too: · Due to volatility penny stocks can be a lot more profitable than blue chip stocks. · Profit is comparable with profit from trading options. · Penny stocks don’t expire unlike options. · Penny stocks don’t have time decay unlike options. · Penny stocks have little correlation to the major markets. · If you are a good stock picker you can find many good penny stocks on the Pink Sheets and OTCBB and some even on the Nasdaq and NYSE. If you decide to trade penny stocks don’t put all your eggs in one basket. You will always have winning trades but you will have losers too. When you buy penny stocks always use limit orders and use limit orders when you sell them. This way you don’t have to sit in front of your computer while the trade is on. The 14 period RSI on the monthly chart is above 70 in overbought territory. Last time this happened in 2006. 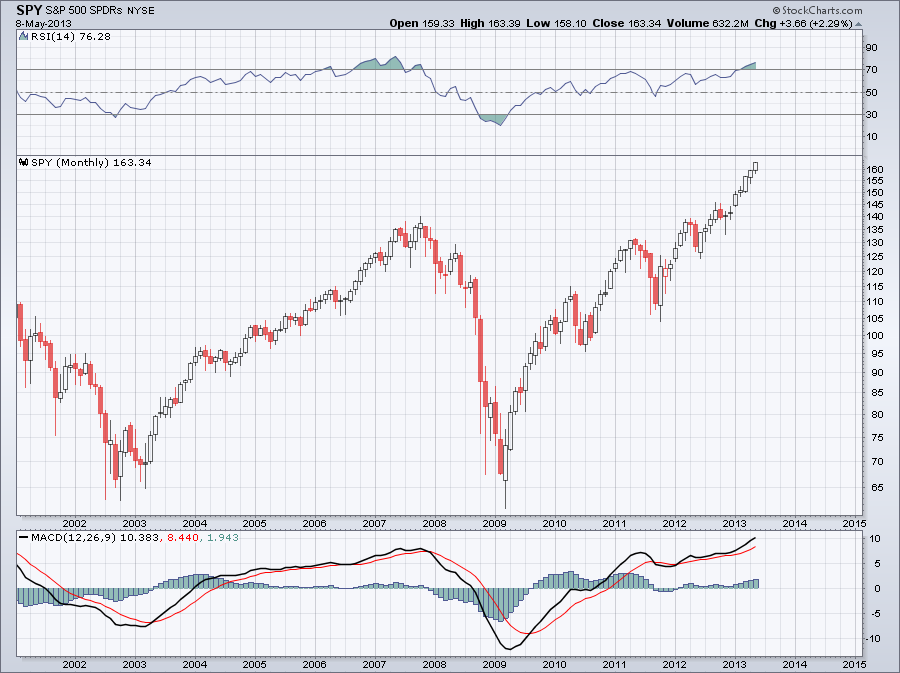 All major US airlines are looking great in the past three months. 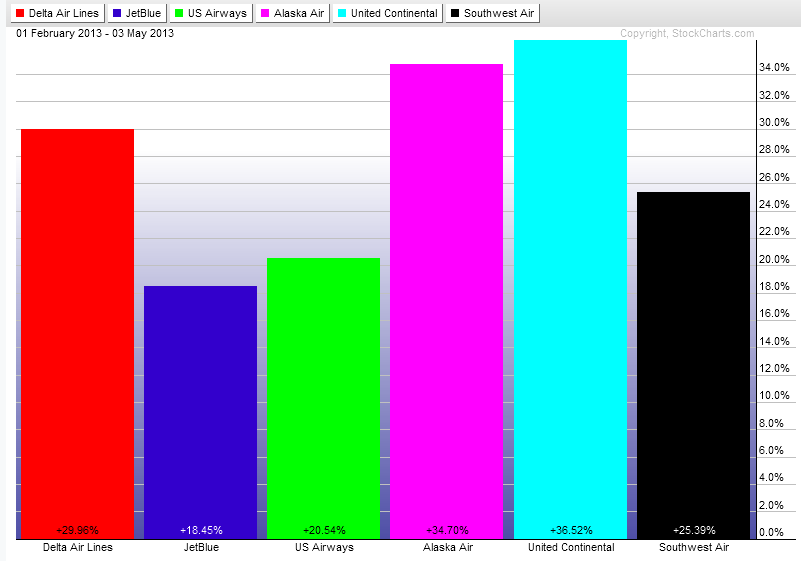
As you can see on the chart below the insider buy activity has been decreasing. Notice the peak in mid-November. 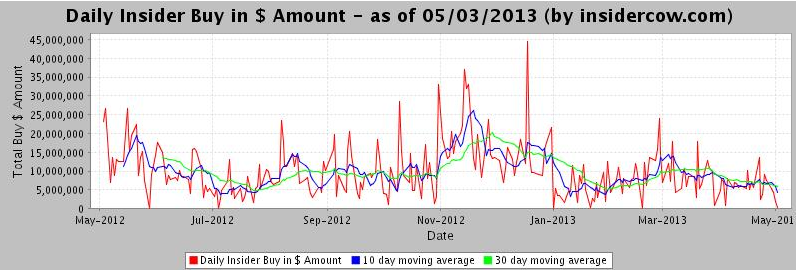
The weekly chart below shows SPY with PPO, which is similar to MACD and StochRSI oscillators. PPO is quite high and although SPY reached higher highs StochRSI didn't reach higher highs. Also notice that SPY already reached the yearly R2 pivot resistance. So what are the chances that it will move higher? 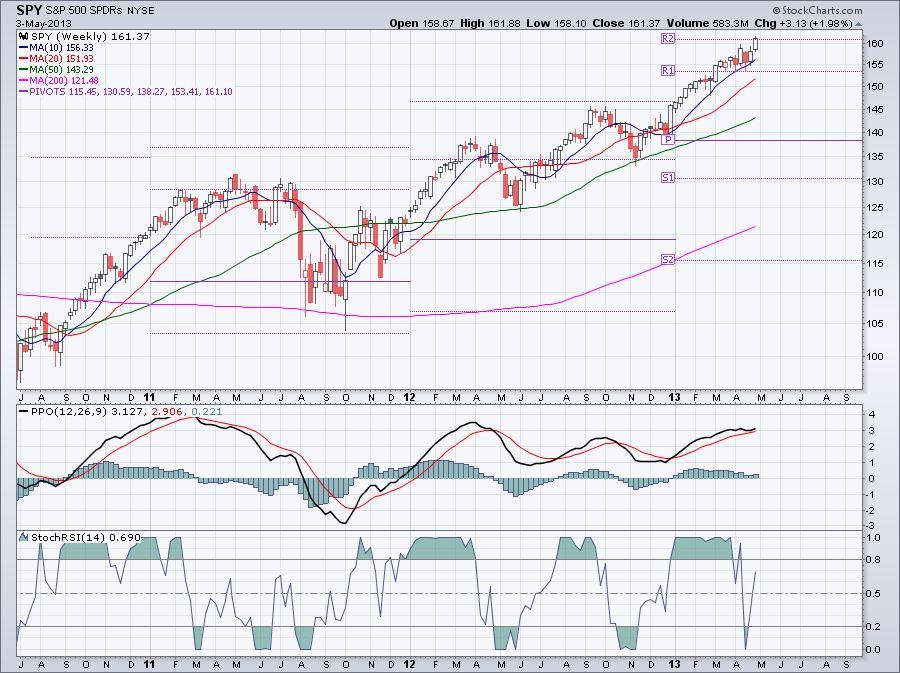 |
Loading
Search Site
Links
Archives
September 2014
Categories
All

|
 RSS Feed
