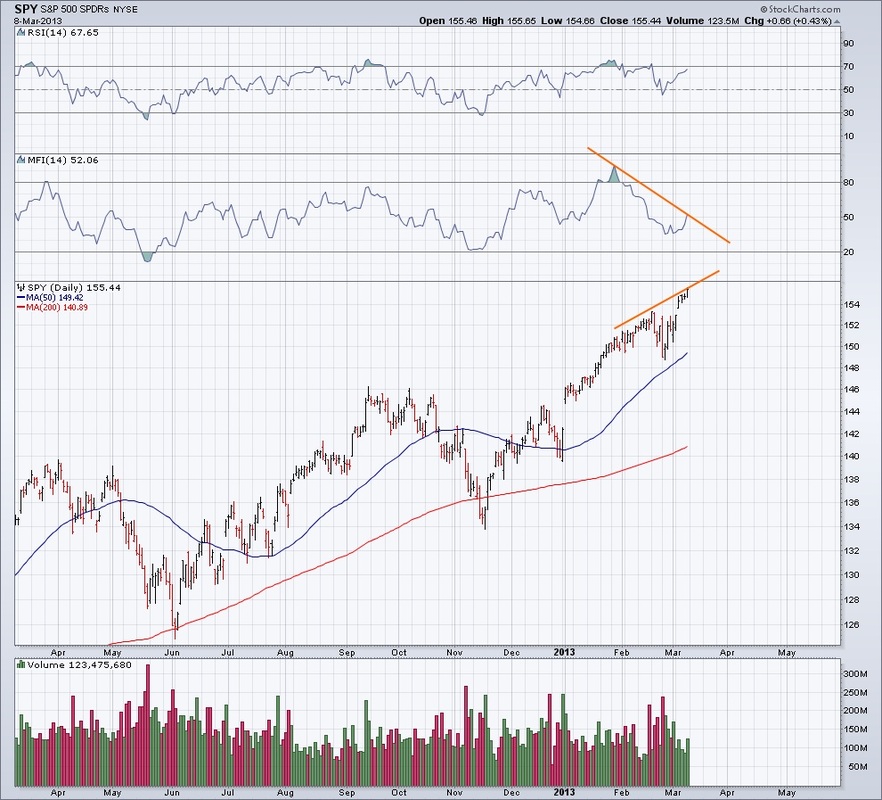
The Money Flow Index (MFI) is calculated both from the price and volume. It's a momentum oscillator that moves between 0 and 100. MFI above 80 considered overbought and below 20 considered oversold. During a strong uptrend MFI can stay overbought and during a strong downtrend it can stay oversold for a longer period of time. The Money Flow Index can be interpreted similar to RSI (Relative Strength Index) but the big difference is volume. Although the two indicators look somewhat similar they are not collinear. The Money Flow Index is most useful indentifying reversals and price extremes. Bearish and Bullish divergences can be used to indentify reversals. The chart below shows SPY with the 14 priod MFI. i added the 14 period RSI too so you can see that there is a difference. As you can see a bearish divergence took place between the oscillator and the price chart. SPY moved higher but MFI moved the opposite direction. We should be able to see during the next couple of weeks if this divergence will give a good signal.

 RSS Feed
